

The start of the year has been marked by heightened geopolitical uncertainty and elevated volatility. Trade tensions have resurfaced, with fresh threats of tariffs on Canada following the signing of a trade agreement between China and Canada. Political rhetoric has also intensified, including criticism directed at members of Congress who voted alongside Democrats to end Canada-related tariffs. Despite this backdrop, financial markets have largely looked through the persistent stream of policy and political headlines.
Equity performance underscores this resilience. Among the three major U.S. indices, the cap-weighted S&P 500 remains roughly flat year to date, while the Dow Jones Industrial Average has gained 3.06%. By contrast, the technology-heavy Nasdaq has declined -2.05% YTD. The equal-weighted S&P 500, however, has advanced 5.5%, highlighting notable dispersion beneath the headline index level. In Canada, the resource-heavy S&P/TSX Composite Index has gained 3.74% YTD.
Geopolitical developments have nevertheless contributed to episodic volatility. President Trump’s provocative comments regarding Greenland — including renewed discussion of expanding U.S. influence over the strategically significant territory — have added to diplomatic tensions with European allies. At the same time, renewed strains with Iran, marked by heightened military posturing and the risk of escalation, have further compounded an already fragile global backdrop.
US Economy
According to Atlanta Fed’s GDPnow, the U.S. economy is projected to grow at a 3.7% annualized pace in Q4 2025, representing a very solid rate of expansion. Inflation data have also been encouraging. The January CPI print appears relatively tame, with headline CPI easing from 2.7% to 2.4% YoY, while core CPI edged down from 2.6% to 2.5%.
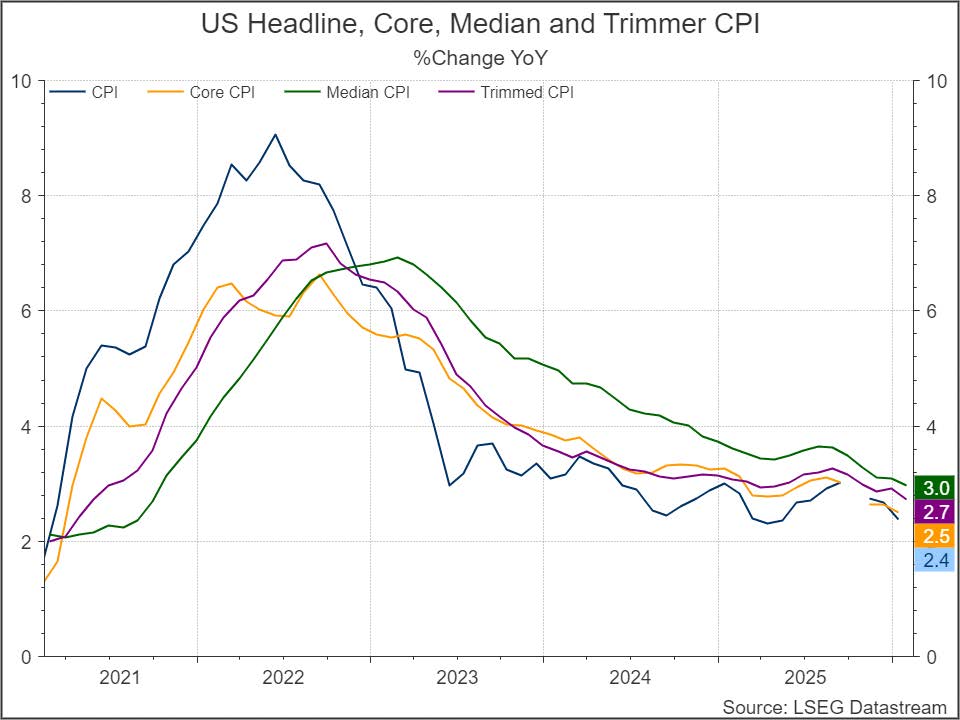
The moderation in inflation was driven primarily by energy prices. Lower retail gasoline prices had the largest impact, with gasoline prices declining 7.5% YoY. Another meaningful contributor was the shelter index, which softened from 3.16% in December to 3.02% YoY in January. Given that shelter represents roughly one-third of consumer spending, disinflation within this component tends to exert an outsized influence on overall CPI dynamics.
The employment picture, however, presents a more mixed backdrop. In January, private-sector non-farm payrolls increased by 172K jobs, while the unemployment rate declined from 4.6% to 4.3%. That said, compositionally, the gains were less encouraging. Approximately 137K of the new jobs were concentrated in the education and healthcare sectors — areas that typically have limited sensitivity to cyclical economic demand.
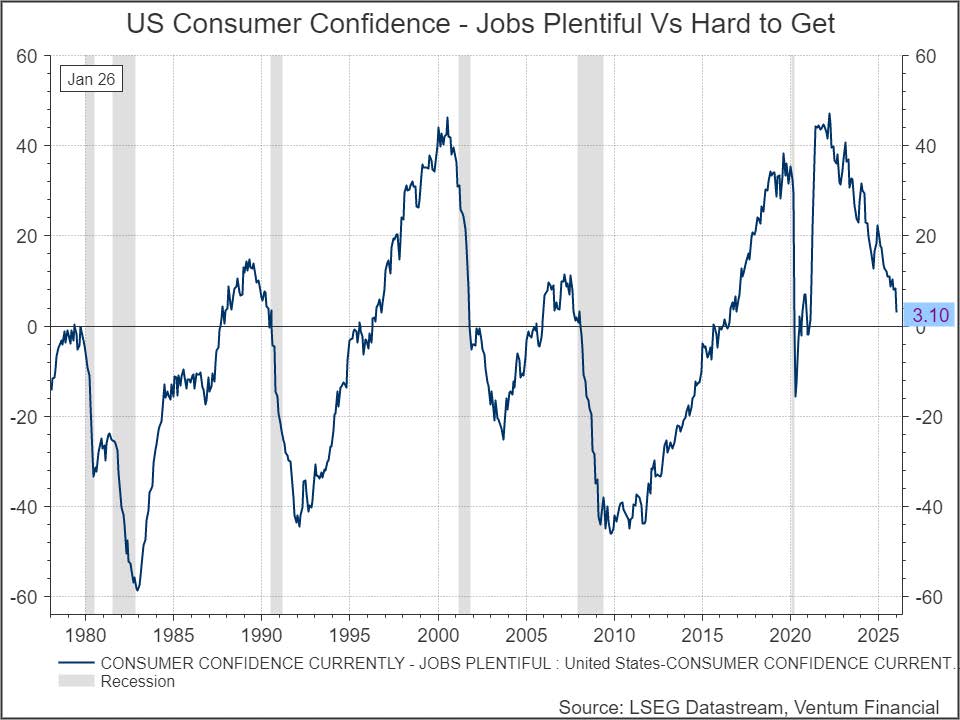
Consumer sentiment also remains subdued. The index measuring respondents who believe jobs are plentiful minus those who believe jobs are hard to get continues to trend lower and currently stands at 3.1, its weakest reading since February 2021. Meanwhile, job openings have declined to their lowest level since September 2020, suggesting ongoing softness in labor market conditions.
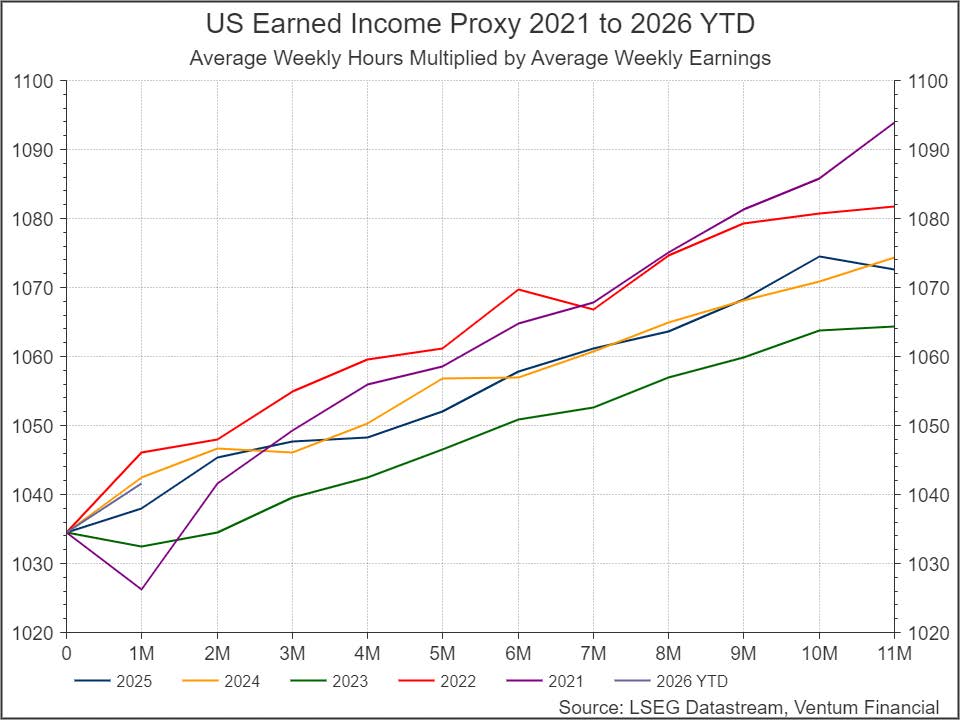
Consumption should continue to demonstrate resilience. The household earned income proxy we monitor — calculated as average weekly hours multiplied by average weekly earnings — remains at a pace near the high end of 2021 and 2022 levels, despite a modest decline in December. While labor market conditions have softened, rising real wages should help sustain aggregate consumption.
Another factor supporting our expectation for resilient consumption in 2026 is the continued strength of household balance sheets. Rising equity markets have generated a meaningful wealth effect, particularly among higher-income households with significant exposure to financial assets. In parallel, a structurally larger cohort of early retirees — largely insulated from labor-market fluctuations and increasingly reliant on investment income — has continued to underpin consumer spending.
Labor force participation among individuals aged 55 years and older has declined from 40.5% in 2019 to 37.9% in January 2026, with the downward trend still intact. This pattern points to a growing preference for early retirement, occurring alongside household wealth levels that remain near all-time highs. Together, these dynamics have helped stabilize aggregate demand despite softer employment trends.
In our view, the U.S. economy continues to grow at a remarkable pace, and additional rate cuts by the Federal Reserve would likely introduce renewed inflationary pressures. The nomination of Kevin Warsh as the next Chair of the Federal Reserve may be interpreted as an effort by the administration to reassure investors that any declines in short-term policy rates will not be overly aggressive, thereby contributing to greater stability along the long end of the yield curve.
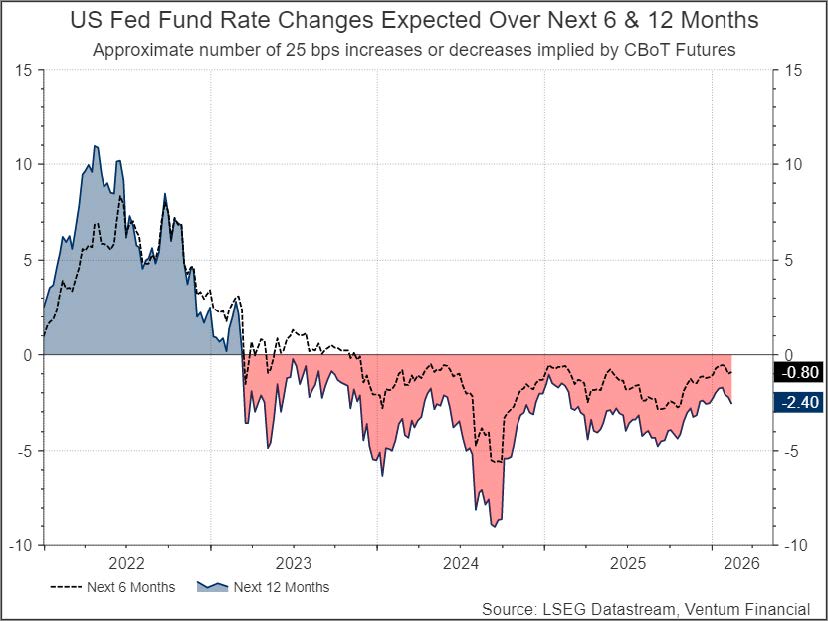
Should the Fed move toward easing, labor market dynamics will remain the primary factor guiding policy decisions, particularly with respect to the timing and magnitude of any further rate adjustments. Market pricing currently implies two 25 bps cuts by year-end 2026.
One area warranting closer attention, however, is the rising delinquency rate for consumer loans. Both credit card and auto loan delinquencies are approaching their post-pandemic highs.
Canadian Economy
Canada’s economy avoided the worst fears in 2025. Despite persistent trade tensions with the U.S., the Bank of Canada in January estimates that the economy likely grew 1.7% in 2025, half a percentage point above its previous October estimate of 1.2%. Exports have held up considerably better than anticipated, supported by the fact that approximately 85% of goods exported to the U.S. remain tariff-free.
The employment backdrop, however, remains mixed. The January report showed the unemployment rate declining from 6.8% in December to 6.5% in January, even as the economy shed 25K jobs.
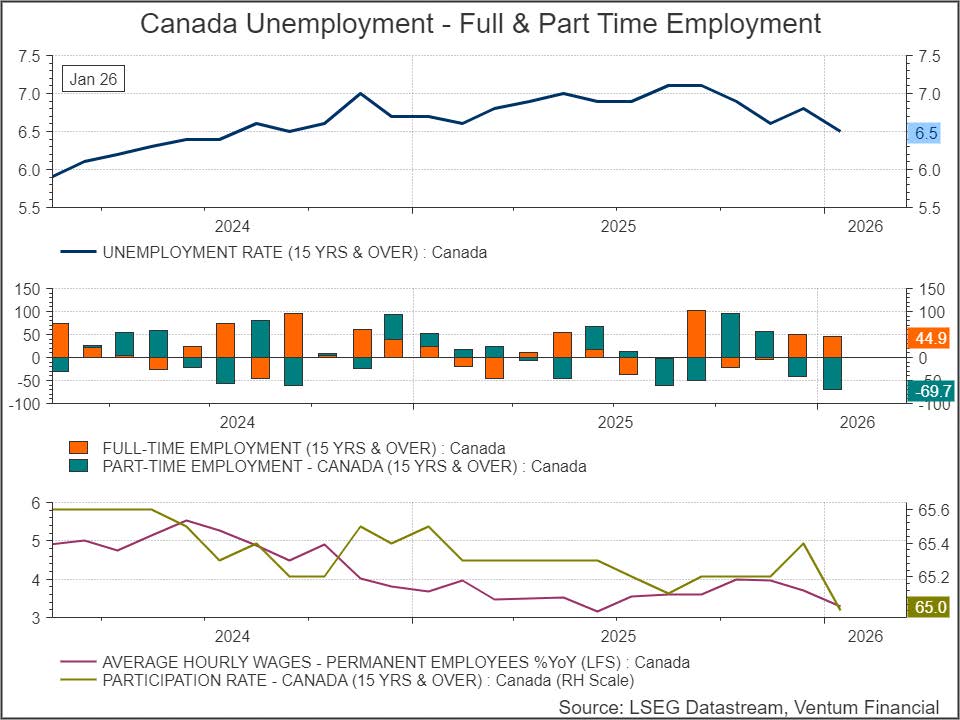
This apparent improvement contains important nuance. December also saw a sharp contraction in Canada’s labour force of 119K, representing the largest one-month decline in the post-COVID period, as temporary workers departed the country in significant numbers.
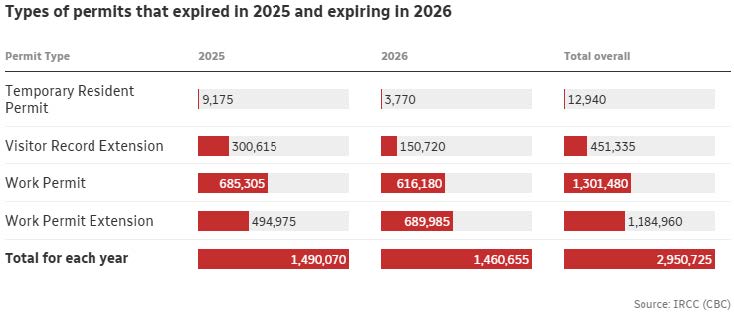
Real wage growth remains positive as inflation pressures continue to dissipate. Growing at 0.22% year-over-year in the latest print. In our view, the moderation in immigration levels may weigh on aggregate consumption but could simultaneously support per capita consumption, as a smaller labour pool improves job prospects for existing workers. Further out, however, this dynamic may become more complex. Roughly 3 million temporary work visas are set to expire between 2025 and 2026, with most unlikely to be renewed, according to research cited by CBC.
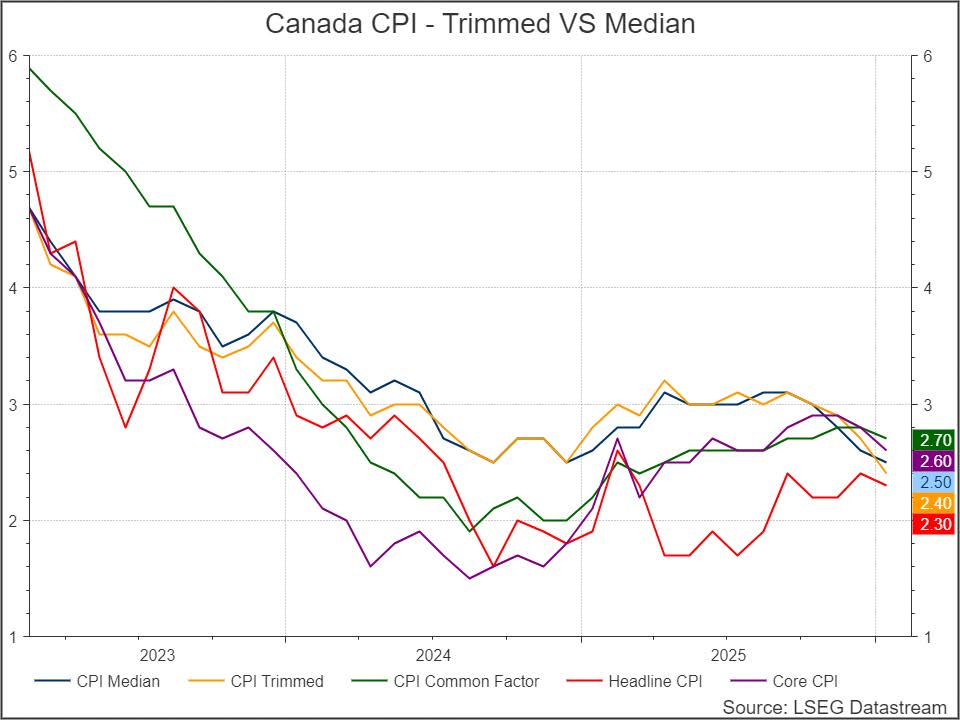
Inflation data from January suggest that price pressures continued to ease. All five measures of CPI — headline, core, trimmed, median, and common factor — point toward further disinflation. Similar to the U.S., declining energy prices are exerting a disinflationary effect. The shelter component, however, presents a notable divergence. Reflecting the sudden departure of workers, Canada’s CPI measure tracking shelter declined month-over-month, while year-over-year growth stands at just 1.7%, below Bank of Canada’s inflation target of 2%.
As in the U.S., shelter remains the single largest component of the CPI basket, representing roughly one-third of consumer spending. Continued moderation in shelter costs could therefore provide an additional disinflationary impulse while simultaneously supporting household consumption.
The Bank of Canada has signaled that policy rates are now near appropriate levels and has indicated readiness to adjust rates in either direction should conditions change. Market pricing currently implies no cuts in 2026, followed by a potential rate increase in 2027. In our assessment, trade tensions and any associated decline in trade volumes with the U.S. remain key risks that could return the Bank of Canada to an easing bias.
Sector Performance – S&P 500
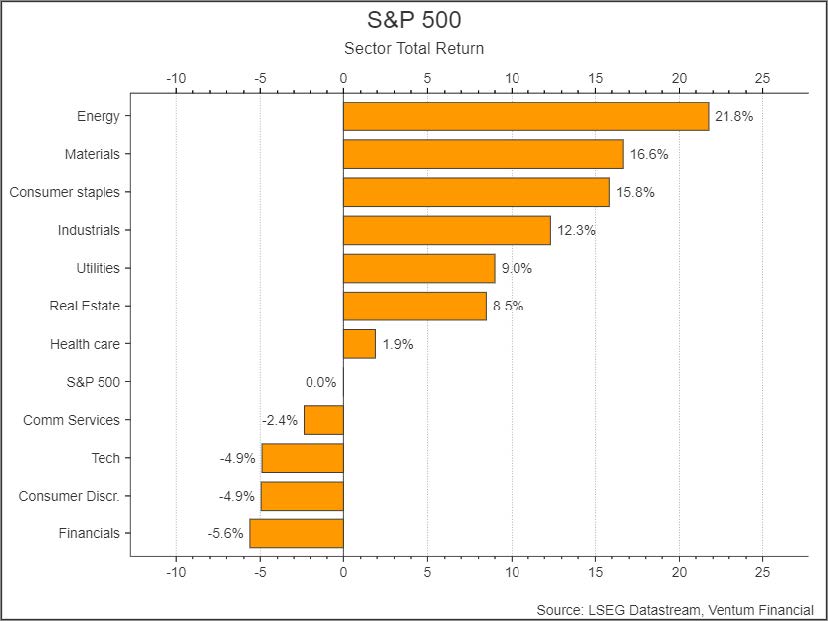
Equity market leadership has shifted meaningfully, with sector performance increasingly reflecting a defensive and real-asset-oriented rotation. The S&P 500 index remains flat year to date, masking significant dispersion beneath the surface. Energy and Materials have emerged as clear outperformers, advancing +21.8% and +16.6%, respectively. At the same time, traditionally defensive segments such as Consumer Staples and Utilities have generated solid gains. In contrast, cyclically sensitive and long-duration growth sectors have lagged, with Financials declining -5.6% and Information Technology -4.9%.
This divergence is consistent with a market that is rotating out of expensive AI and software stocks and into companies that are more grounded in valuation. Strength in commodity-linked sectors suggests that investors continue to position for resilient nominal activity and the potential persistence of inflation-sensitive dynamics. Meanwhile, leadership from defensive sectors points to a growing preference for earnings stability.
Another theme we are observing is an increasingly aggressive rotation out of software and long-duration growth equities. Concerns surrounding AI-driven disruption — particularly the perception that AI may compress margins, reduce pricing power, or displace portions of traditional software demand — have contributed to a broad-based repricing across the segment. The weakness is no longer confined to core software names but has begun to spill over into adjacent industries, including real estate brokerage, logistics brokerage, and even engineering and consulting firms, where investors are reassessing the durability of business models exposed to automation and AI-enabled efficiencies.
Performance dispersion highlights the magnitude of this rotation. Year to date, the cap-weighted Roundhill Magnificent Seven ETF has declined -7.11%, while the equal-weighted S&P 500 has advanced +5.72%, underscoring a clear shift away from mega-cap growth leadership. Within the technology complex, the drawdown has been even more pronounced, with the iShares Expanded Tech Software ETF down -23.4%.
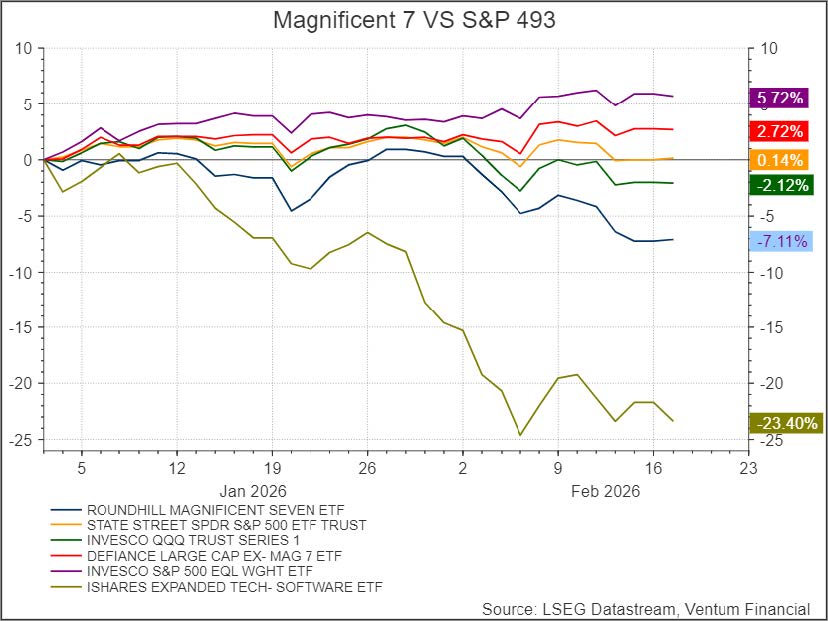
This pattern is consistent with a market environment in which valuation sensitivity, crowding, and disruption risk are simultaneously driving sector-level divergences. As AI narratives evolve from growth optimism toward competitive threat assessment, investors appear increasingly selective, favoring earnings resilience and balance sheet strength over duration-heavy growth exposures.
Sector Performance – S&P/TSX Composite
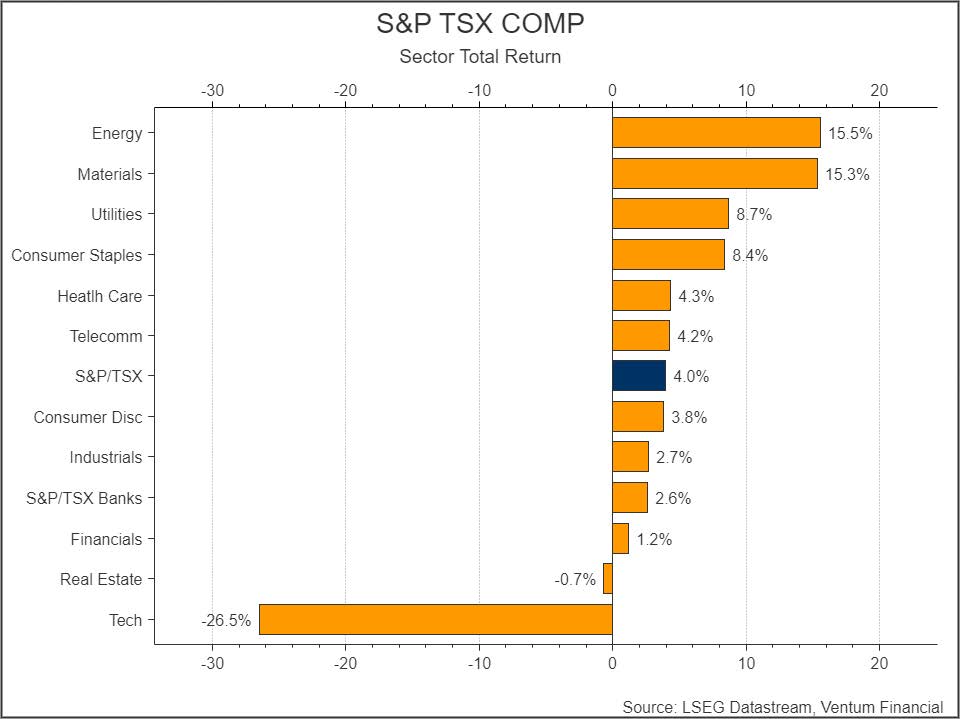
In Canada, we are observing a similar rotation dynamic. The S&P/TSX Composite Index has gained 3.6% year to date, though headline performance again masks notable sector divergences. The Information Technology sector has declined -26.5% YTD, weighed down primarily by weakness in software names. By contrast, Energy has emerged as the strongest-performing sector, advancing 15.5% year to date and reinforcing the broader rotation toward value-oriented equities and real assets.
Within the commodity complex, gold has exhibited pronounced volatility. The gold price began the year at approximately $4,300 USD per troy ounce, surged to a peak near $5,400 on January 28th, and has since retraced to roughly $4,800 at the time of writing. This sharp price movement highlights the market’s shifting expectations around inflation, policy uncertainty, and safe-haven positioning.
Despite the volatility in gold, Canada’s Materials sector has posted a solid gain of +15.3% YTD, benefiting from continued investor preference for real-asset exposure and commodity-linked earnings resilience.
Investment Strategy and Outlook
We expect U.S. economic growth to remain robust over the next 12 months, with particular emphasis on the emerging theme of investment-led expansion. While labor market conditions are likely to remain soft, high corporate profit growth (15.08% for NTM) and forward-looking indicators increasingly point toward a gradual improvement in business activity and capital spending.
Market-based signals are reinforcing this view. The Dow Jones Industrial Average recently closed above the psychologically significant 50,000 level on February 6th. On the same day, the Dow Jones Transportation Average surged to its own all-time high, reaching 19,892.36. In technical analysis, this alignment is commonly referred to as a Dow Theory Buy Signal.
The theory — now more than a century old — posits that for a bull market to be considered healthy and sustainable, both averages must confirm one another by reaching new highs. The intuition is straightforward: if industrial companies are producing record volumes of goods, the firms responsible for transporting those goods should also experience strengthening demand.
Survey-based indicators are beginning to echo this message. The ISM Manufacturing Index recently broke above the expansion threshold of 50 for the first time since 2022, rising to 52.6 in the latest reading — an increase of nearly five points from December’s 47.9.
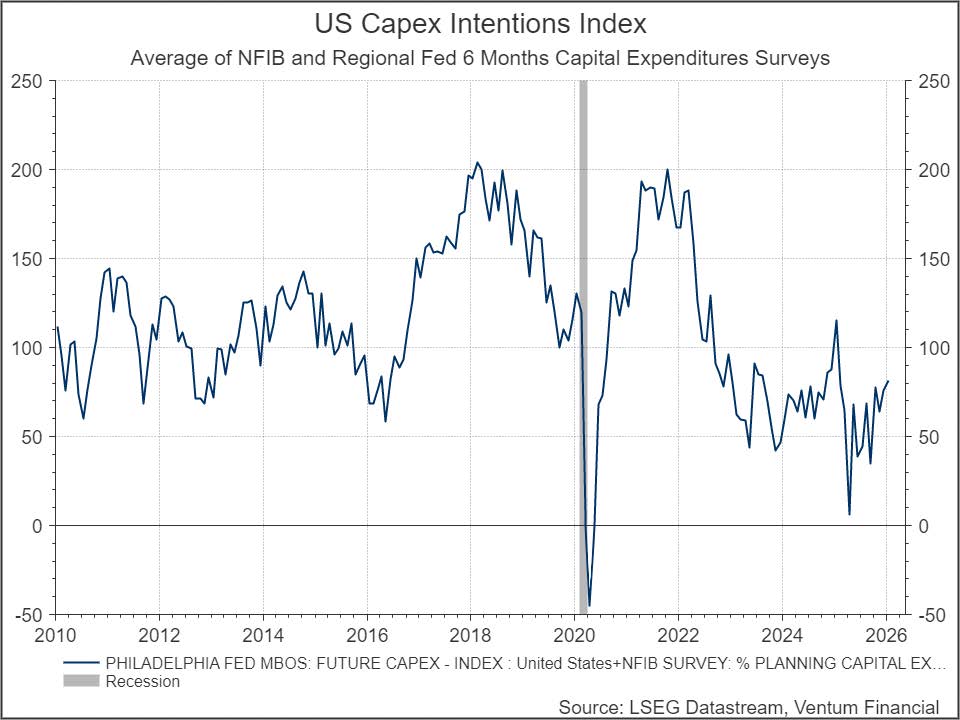
Beyond manufacturing, surveys of capital expenditure intentions — including NFIB and various regional Federal Reserve measures — have been trending higher from last year’s lows. This shift suggests that firms are becoming incrementally more willing to deploy capital, pointing toward increased capex over the coming months. Such a development represents an encouraging signal for productivity gains and the durability of the broader growth cycle.
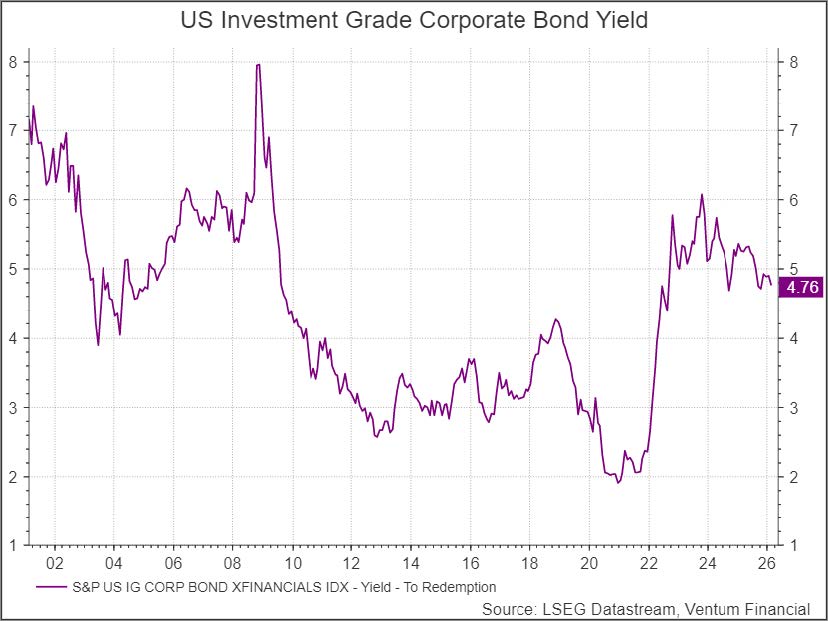
Yields on U.S. investment-grade corporate bonds have declined significantly from their 2023 highs, reflecting the broader normalization in financial conditions. The S&P U.S. Investment Grade Corporate Bond Index (ex Financials) currently yields 4.76%, a level far more consistent with the prevailing environment of the 2010s than the elevated peaks observed in 2023 and 2024.
This compression in yields suggests that credit markets are increasingly pricing a backdrop of macro stability, moderating inflation pressures, and reduced policy uncertainty. Importantly, easier financing conditions may also provide incremental support for corporate balance sheets and future investment activity.
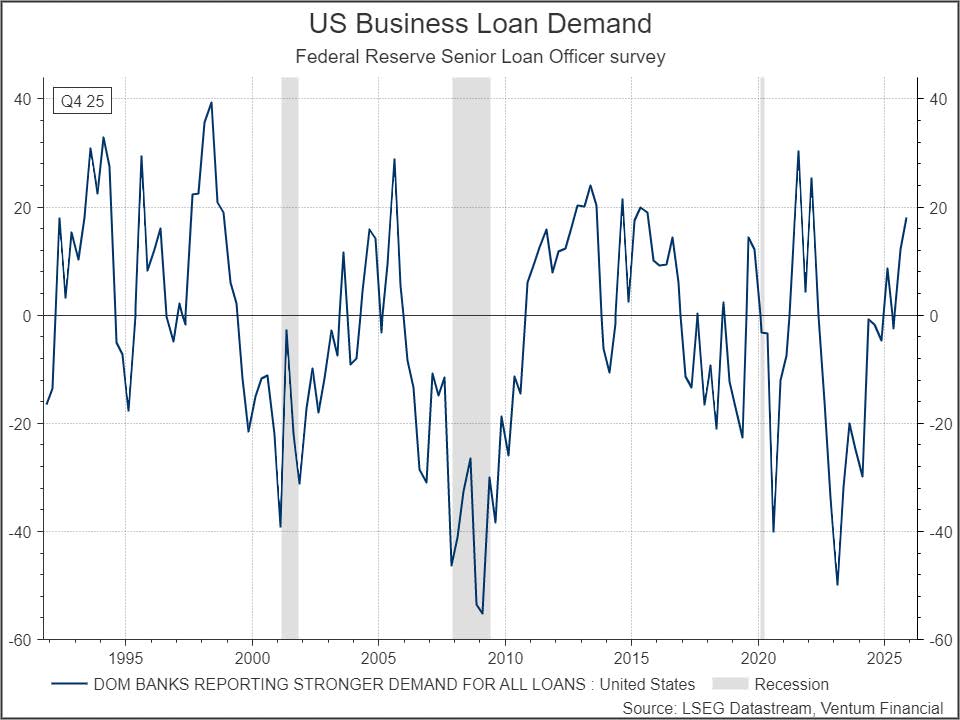
Business loan demand, which contracted sharply in 2023, has begun to turn higher, pushing back toward expansionary territory. The index has risen to levels not seen since 2021, suggesting that credit conditions for firms are gradually easing. When viewed alongside improving capex intentions and the normalization of corporate bond yields, these dynamics collectively point to a fundamentally robust backdrop for the U.S. economy.
While 2025 was defined by tremendous capital expenditure concentrated in the AI ecosystem, we expect 2026 to mark the beginning of a broader investment cycle. Capital spending is likely to increasingly extend into sectors less directly tied to AI, reflecting improving confidence in demand durability, financing conditions, and balance sheet flexibility.
We continue to favor Industrials, Materials, and Financials, where the combination of improving investment dynamics, earnings resilience, and valuation support remains compelling. We also maintain a constructive view on Information Technology, though we recognize that leadership within the sector is evolving.
Recent market behavior suggests an ongoing rotation away from software and toward companies with greater exposure to tangible assets and infrastructure-linked spending. As a result, positioning within technology should remain selective, with an emphasis on business models less vulnerable to disruption-driven repricing.
Meanwhile, a similar dynamic appears to be developing in Canada. S&P Global’s Manufacturing PMI recently moved back into expansionary territory, reaching 50.4 in January, marking a notable improvement in business activity.
While we believe an investment-led theme may also be taking shape domestically, we remain cautious on the broader outlook. The Canadian economy continues to exhibit a high degree of dependence on U.S. demand, despite recent policy efforts by Prime Minister Carney aimed at attracting manufacturing investment from Asian economies such as South Korea and China.
In our view, the upcoming renegotiation of the USMCA remains a key source of uncertainty and a potential overhang for Canadian manufacturers, particularly those operating within export-sensitive industries.
We remain underweight the TSX Energy sector, reflecting the continued downward trend in energy prices, which now sit at their lowest levels in five years, alongside rising global inventories. These dynamics suggest a less supportive backdrop for earnings and price performance within the sector.
That said, the outlook remains inherently sensitive to geopolitical developments. Shifts in supply dynamics — whether driven by escalating tensions or unexpected stabilization — could materially alter the trajectory of energy markets.
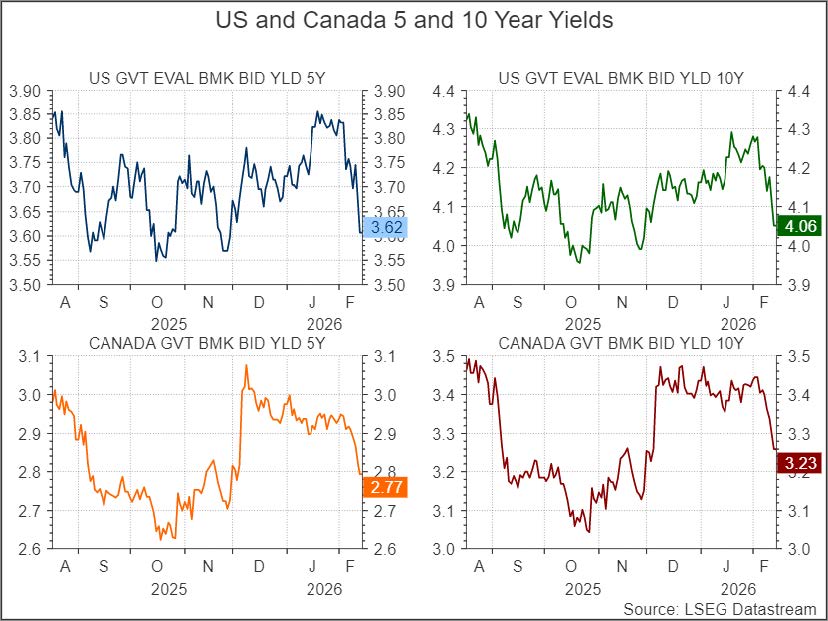
We expect long-term interest rates to remain broadly stable in 2026. In our December 2025 outlook, we anticipated upward pressure on long-term yields, driven by robust economic growth, elevated fiscal stimulus, a sharp decline in short-term rates, and heightened policy uncertainty surrounding Federal Reserve independence.
Since then, the primary factor prompting a reassessment of our view has been the nomination of Kevin Warsh as Chair of the Federal Reserve. Unlike Kevin Hassett, who has publicly advocated for a more aggressive reduction in the federal funds rate, Warsh is widely perceived as more hawkish. This distinction carries important implications for the yield curve.
A comparatively hawkish policy stance would likely place greater emphasis on inflation credibility and financial stability, reducing the probability of drastic rate cuts. In turn, this could contribute to greater stability along the long end of the yield curve, even as policy expectations evolve.
© 2018-2023 Refinitiv. All rights reserved. Republication or redistribution of Refinitiv content, including by framing or similar means, is prohibited without the prior written consent of Refinitiv. Refinitiv and the Refinitiv logo are trademarks of Refinitiv and its affiliated companies.
Ventum Financial Corp. www.ventumfinancial.com
Vancouver Office
2500 – 733 Seymour Street
Vancouver, BC V6B 0S6
Ph: 604-664-2900 | Fax: 604-664-2666
For a complete list of branch offices and contact information, please visit our website.
Participants of all Canadian Marketplaces. Members: Canadian Investment Regulatory Organization, Canadian Investor Protection Fund and AdvantageBC International Business Centre – Vancouver. Estimates and projections contained herein are our own and are based on assumptions which. we believe to be reasonable. Information presented herein, while obtained from sources we believe to be reliable, is not guaranteed either as to accuracy or completeness, nor in providing it does Ventum Financial Corp. assume any responsibility or liability. This information is given as of the date appearing on this report, and Ventum Financial Corp. assumes no obligation to update the information or advise on further developments relating to securities. Ventum Financial Corp. and its affiliates, as well as their respective partners, directors, shareholders, and employees may have a position in the securities mentioned herein and may make purchases and/or sales from time to time. Ventum Financial Corp. may act, or may have acted in the past, as a financial advisor, fiscal agent or underwriter for certain of the companies mentioned herein and may receive, or may have received, a remuneration for their services from those companies. This report is not to be construed as an offer to sell, or the solicitation of an offer to buy, securities and is intended for distribution only in those jurisdictions where Ventum Financial Corp. is registered as an advisor or a dealer in securities. Any distribution or dissemination of this report in any other jurisdiction is strictly prohibited.
For further disclosure information, reader is referred to the disclosure section of our website.