

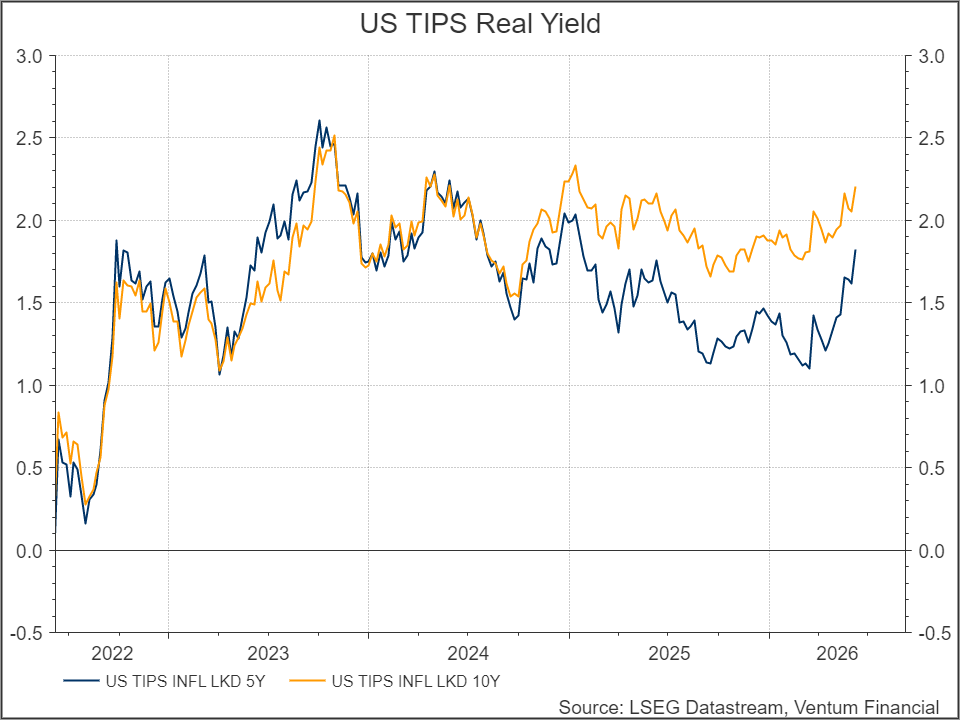
The three major US indices have continued lower since Friday’s employment report — the Nasdaq’s 4.2% slide on the print marking its worst session since April 2025, with the pain concentrated in semis where SOXX sank 10.3% for its worst day since Liberation Day — and the tape is telling you why. The 5-year real yield broke to a fresh 52-week high on the report and now sits at 1.8%, and critically, it has done so even as crude oil has come off its recent peaks; this is not an oil-driven repricing but a growth-and-policy one.
With inflation expectations still elevated, a labor market re-tightening rather than cooling, and real growth running well above stall speed, we think the Fed will find it increasingly difficult to justify standing pat, let alone cutting. Hormuz is stealing the headlines and the high oil price is the easy narrative, but we would caution that a rising real yield is just as large a problem for risk assets — and arguably the more durable one.
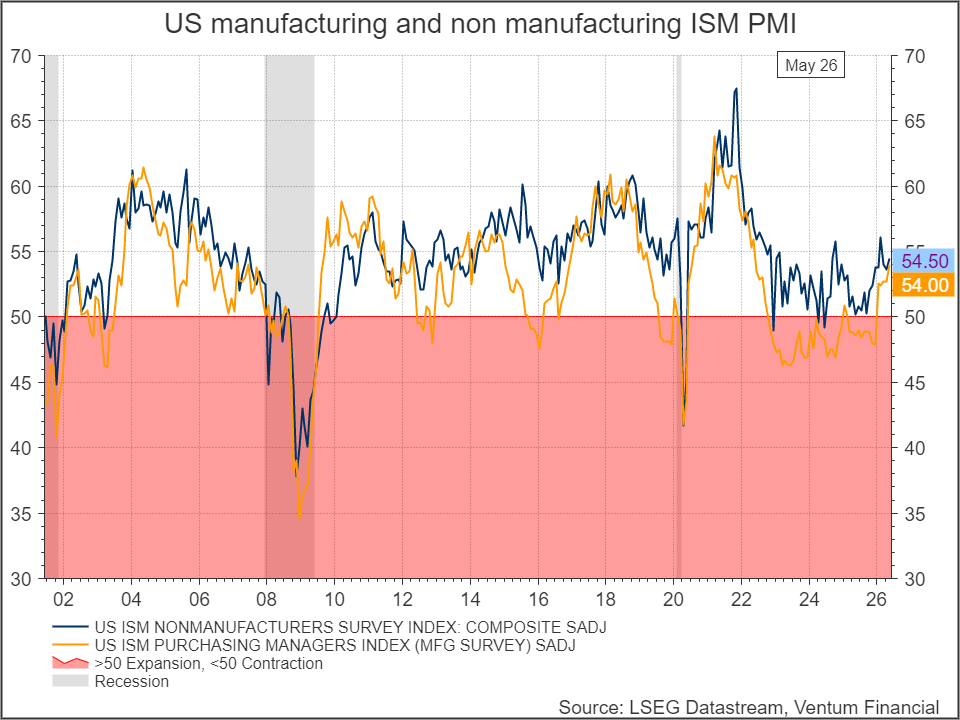
The growth backdrop is unambiguous. Both ISM surveys sit firmly in expansion, with manufacturing printing 54.0 and services 54.5 — and notably, it is the manufacturing side that has done much of the recent heavy lifting after years languishing below 50. When both surveys move higher in tandem above the boom/bust line, the message is broad-based expansion rather than a services economy coasting on momentum. In real terms, US growth is solid, and there appears little in the survey data to fade.
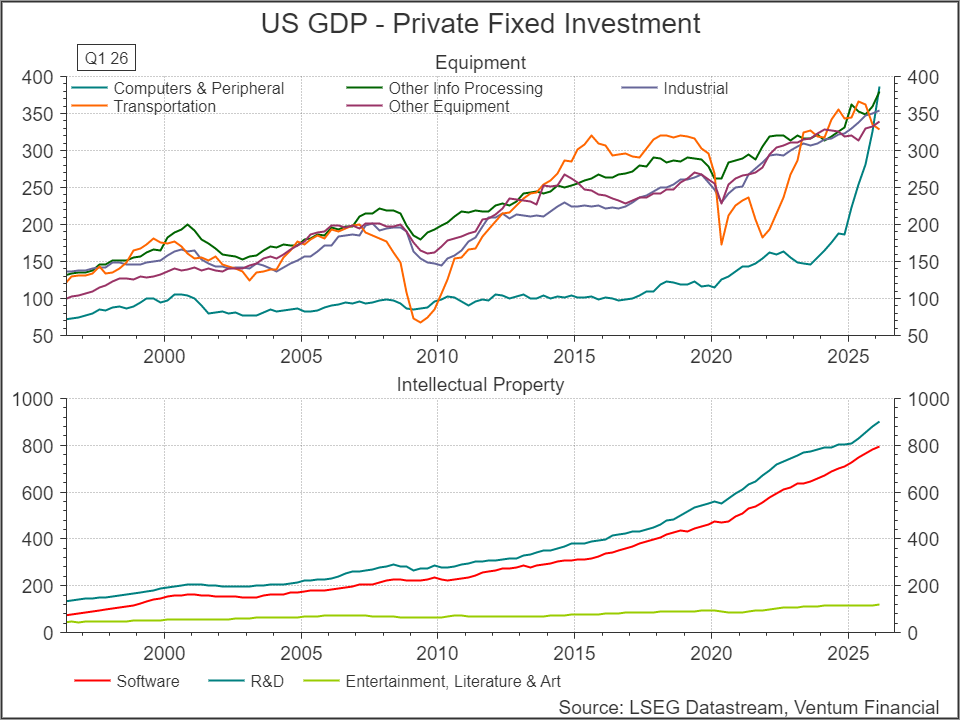
The engine of that growth is capex, and the composition is what gives us conviction in its durability. Investment in computers and peripheral equipment has gone parabolic, but the more important development is the broadening underneath: industrial equipment, information processing, and other equipment categories are all making new highs, while on the intellectual property side software and R&D investment have roughly doubled since 2020. This is no longer a handful of hyperscalers buying GPUs — the AI capex cycle is bleeding into adjacent industries, and that is precisely what turns a theme into a cycle.
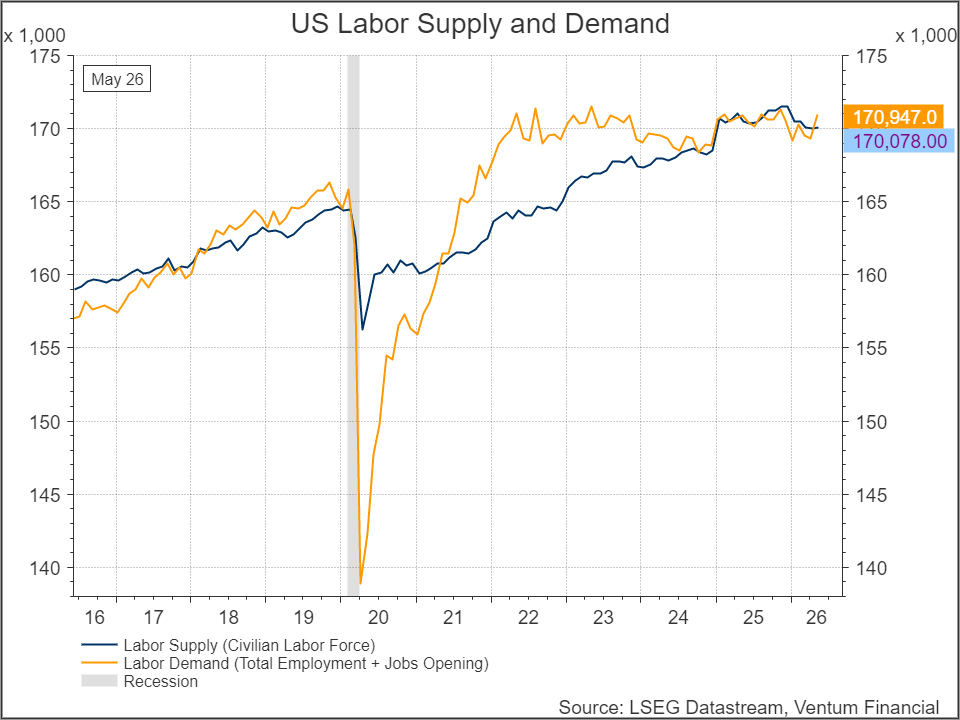
The consumer never needed convincing. Household wealth near record levels has kept spending resilient, and Friday’s employment report reaffirmed that the income side of the equation remains intact. More telling than the headline print, however, is the balance underneath: labor demand — total employment plus job openings pulled forward one month — is once again running ahead of labor supply, at 170.9 million versus 170.1 million. The last time demand sustainably outpaced supply, the result was the 2021–22 wage surge. We are not there yet, but the direction of travel matters.
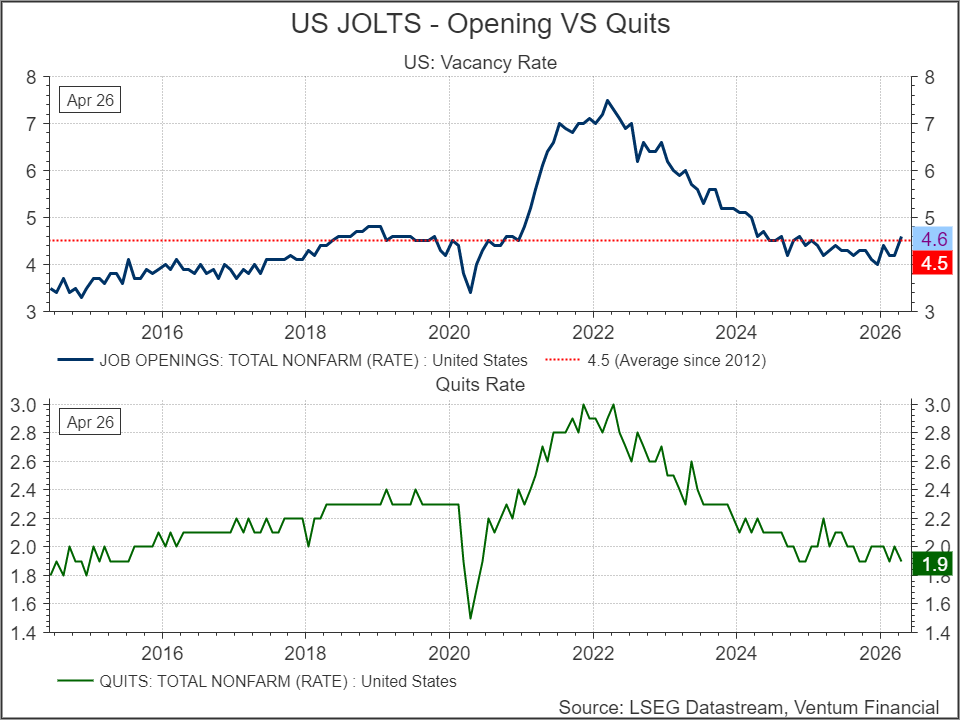
The JOLTS data corroborate the tightening. The vacancy rate has climbed back to 4.6, just above the 4.5 average that has held since 2012 — a threshold worth respecting, since openings spent the entire post-pandemic normalization grinding down toward it and are now bouncing off it. The quits rate remains subdued at 1.9, so workers are not yet voting with their feet, but a labor market re-tightening from a position of full employment is not one the Fed can comfortably ease into.
The rates market has already drawn the obvious conclusion. Stripping out inflation expectations, real yields are climbing again: the 5-year TIPS has rebounded sharply toward 1.8% after basing through 2025, and the 10-year has pushed back above 2.2%. Rising real yields against accelerating surveys and a tightening labor market is the bond market’s way of telling you the neutral rate is higher than the Fed’s current framework allows for.
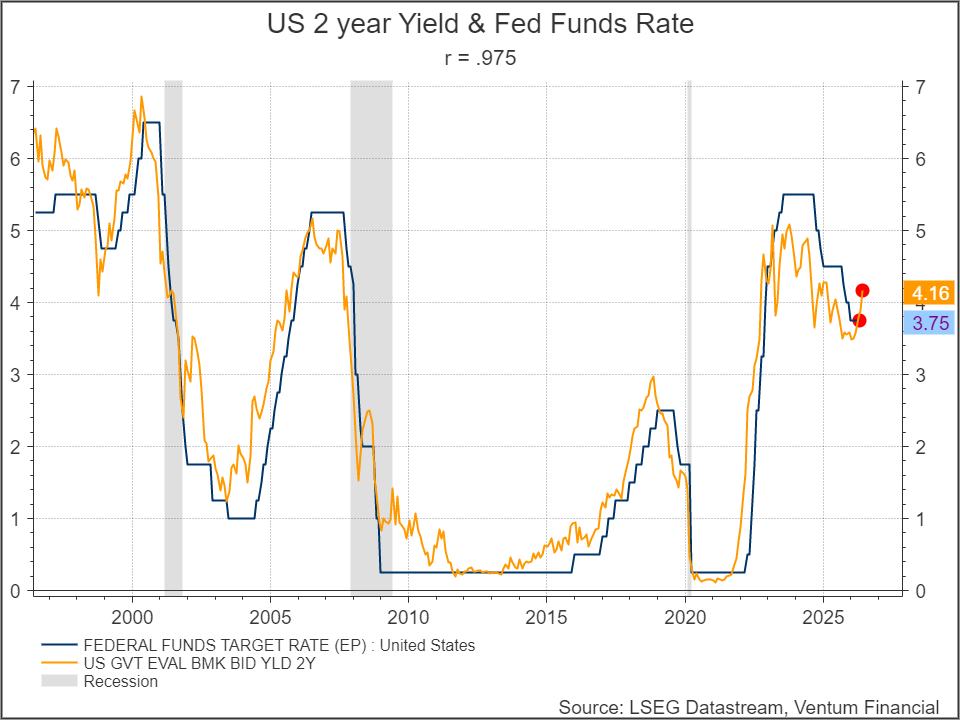
The front end is even more direct. The 2-year yield — historically the cleanest read on the policy path, with a 0.975 correlation to the funds rate — now trades roughly 40bps above the target at 4.16% versus 3.75%. The 2s have led every meaningful policy turn of the last two decades, and they are not pricing cuts; they are pricing hikes. The Fed will eventually follow where the curve leads.
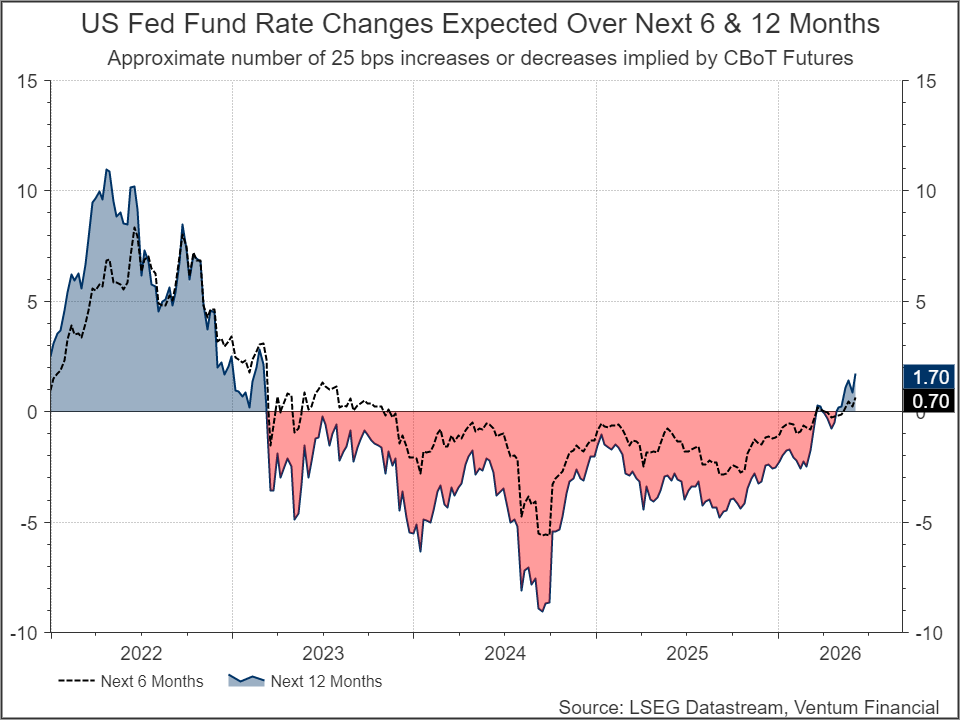
Futures markets agree. For the first time since the 2022 tightening cycle, the implied path is for higher rates, not lower — almost two 25bp hikes priced over the next 12 months and almost one over the next 6. The repricing has been swift and one-directional, and we would not stand in front of it.
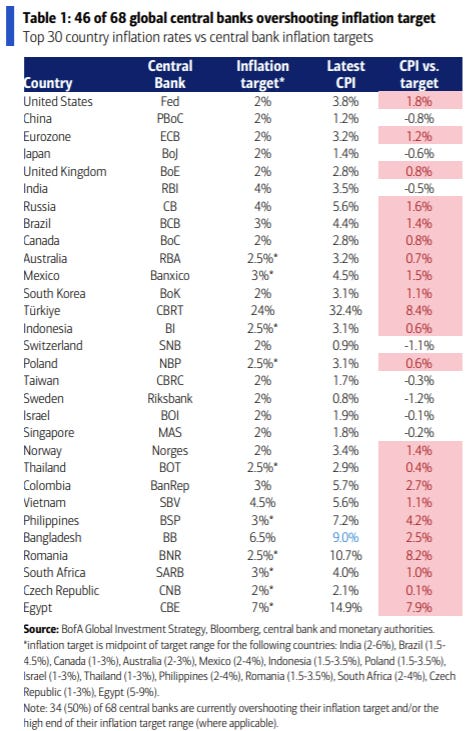
On inflation, we think the resolution of the Hormuz situation brings crude lower from here, but near-term supply bottlenecks mean a return to the ~$50 levels of late last year may not be in the cards. The broader picture is also less comforting than the disinflation narrative suggests: 46 of 68 global central banks are currently overshooting their inflation targets, with the Fed itself running 1.8 points hot at 3.8% CPI versus a 2% target. This is a global problem, not a US idiosyncrasy, and it constrains how dovish any one central bank can credibly be.
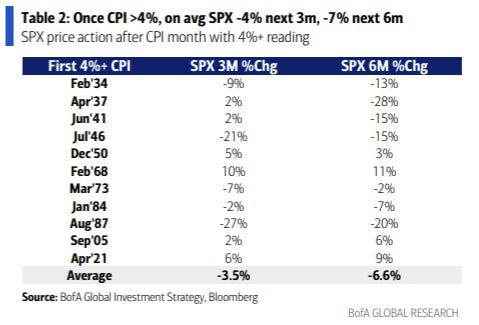
The market implication is where we land more cautiously than the macro picture alone would suggest. History is unkind to equities once inflation breaches the 4% threshold: per BofA, the S&P 500 has averaged -3.5% in the three months following a first 4%+ CPI print and -6.6% over six months. Solid real growth, a re-tightening labor market, and sticky global inflation is a combination that supports the economy but pressures the multiple — and that asymmetry is what we are positioned for.
Han Li . MA CFA
Bert Quattrociocchi, BA CFA
Discretionary Asset Management and Portfolio Strategy
© 2018-2023 Refinitiv. All rights reserved. Republication or redistribution of Refinitiv content, including by framing or similar means, is prohibited without the prior written consent of Refinitiv. Refinitiv and the Refinitiv logo are trademarks of Refinitiv and its affiliated companies.
Ventum Financial Corp. www.ventumfinancial.com
Vancouver Office
2500 – 733 Seymour Street
Vancouver, BC V6B 0S6
Ph: 604-664-2900 | Fax: 604-664-2666
For a complete list of branch offices and contact information, please visit our website.
Participants of all Canadian Marketplaces. Members: Canadian Investment Regulatory Organization, Canadian Investor Protection Fund and AdvantageBC International Business Centre – Vancouver. Estimates and projections contained herein are our own and are based on assumptions which. we believe to be reasonable. Information presented herein, while obtained from sources we believe to be reliable, is not guaranteed either as to accuracy or completeness, nor in providing it does Ventum Financial Corp. assume any responsibility or liability. This information is given as of the date appearing on this report, and Ventum Financial Corp. assumes no obligation to update the information or advise on further developments relating to securities. Ventum Financial Corp. and its affiliates, as well as their respective partners, directors, shareholders, and employees may have a position in the securities mentioned herein and may make purchases and/or sales from time to time. Ventum Financial Corp. may act, or may have acted in the past, as a financial advisor, fiscal agent or underwriter for certain of the companies mentioned herein and may receive, or may have received, a remuneration for their services from those companies. This report is not to be construed as an offer to sell, or the solicitation of an offer to buy, securities and is intended for distribution only in those jurisdictions where Ventum Financial Corp. is registered as an advisor or a dealer in securities. Any distribution or dissemination of this report in any other jurisdiction is strictly prohibited.
For further disclosure information, reader is referred to the disclosure section of our website.