
Canadian and US Economy: Growth downshifted on both sides of the border — US GDPNow fell to 1.6% on net-export drag while consumer spending held steady. Canada’s core inflation rate remains near target while per-capita GDP economic growth ticked higher.
Equity Markets: Leadership flipped as the technology heavy Nasdaq-100 gave back gains to the S&P 500, with value stocks overtaking momentum companies and markets punishing the heaviest AI capex spenders.
Bond Market: Yields climbed on both sides of the border as the Fed leaned hawkish into a reignited Iran conflict and resulting higher energy prices. The US-Canada bond spread widened only modestly with the BoC on hold.
Currencies and commodities: The yen hit fresh multi-decade lows amid Japan’s weak growth and mounting debt concerns, while gold rebounded and oil spiked on the collapsed Middle East ceasefire. The Cdn dollar strengthened slightly against the US on higher oil prices.
Portfolio Strategy: We’re holding our core sector preferences with added caution on stretched, technology, industrials and rate-sensitive names. Canadian banks as relatively durable holds but caution their record high valuations.
Equity Markets
July was another month of whiplash. The AI-led unwind that began in June kept bleeding into the first half of the month, then a fragile US-Iran ceasefire broke down entirely — Washington resumed strikes on July 8, Tehran hit tankers in the Strait of Hormuz, and Brent Crude spiked back above $100 a barrel, with US gas prices up roughly 34% since the war began. Equities spent the month reacting to that on top of a resumed AI-infrastructure selloff, a run of hawkish Fed repricing, and the buildup to this week’s FOMC decision and a wave of Big Tech earnings (Amazon, Meta, Microsoft, and Apple all report this week).
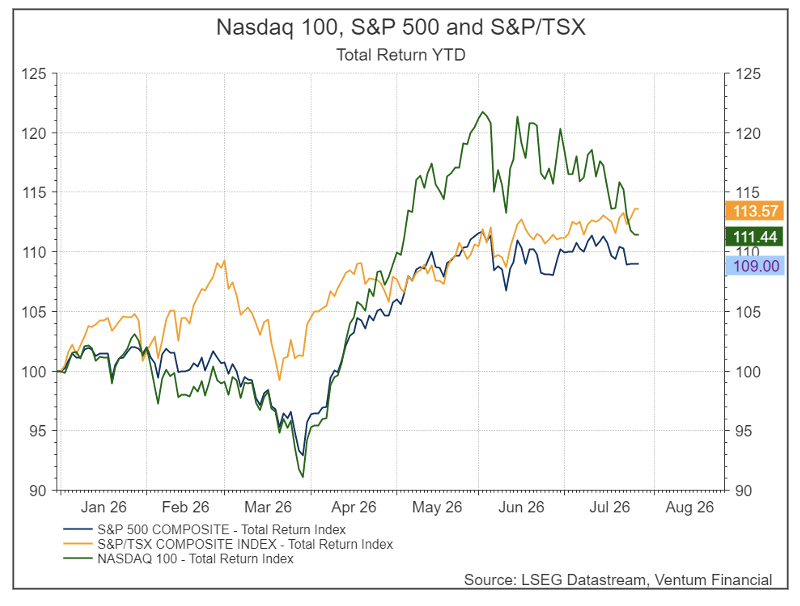
The more diversified S&P 500 has pulled essentially even with the Nasdaq-100 on a total-return basis. The S&P 500 is up +9.0% YTD, the S&P/TSX Composite is up roughly +13.5%, while the Nasdaq-100 has fallen back to +11.4% YTD — down sharply from the +15.7% it carried at the end of June. That’s a meaningful change in leadership: the index that was up most this year is now the one bleeding hardest, as chip and AI-infrastructure names take another leg down. On July 27 alone, Nvidia fell roughly 5% even after unveiling a $500 billion AI memory-chip supply deal with SK Hynix and guaranteeing $250 billion of compute capacity to OpenAI — a deal that reignited worries about circular AI financing arrangements unwinding if hyperscaler capex ever slows. Micron, AMD, SanDisk, and SK Hynix all posted steep losses the same day.
Adding to that AI-financing worry is a fresh competitive one: China’s CXMT went public in Shanghai this week and surged 466% on debut, briefly valued near $487 billion, while separate reports confirmed China has begun mass-producing its first homegrown DUV lithography machines. The news compounded the chip selloff — Nvidia, AMD, Micron, SK Hynix, SanDisk, and ASML all fell further, together shedding over $1 trillion in market cap — as investors weighed a new long-term threat: that China may be closing the semiconductor gap faster than expected.
The factor/style leaderboard reflects all of this. Value has now overtaken Momentum on a YTD basis (+21.4% vs. +18.1%), a genuine leadership change from earlier in the year when Momentum, High Volatility, and Growth (all still clustered around +18%) led the pack during the AI-driven melt-up.”
US Economy
Economic growth downshifted again this month. GDPNow now has Q2 at just 1.6% (SAAR), down from 2.5% in late June and well off the quarter’s 4.3% peak in May. Most of the drag is net exports — consumer spending has barely budged since the quarter began and is still tracking around 1.67% growth. Non residential investments picked up pace, now contributing 1.13% to this quarter’s projected growth.
June inflation CPI index cooled to 3.5% y/y (core 2.6%), a 5.7% m/m drop in energy prices doing most of the work as gasoline eased on the brief US-Iran ceasefire. That ceasefire has since collapsed and oil has spiked back above $90/barrel, so the relief in this print is already stale — most economists expect headline inflation to reaccelerate in the July data as pump prices climb again.
The labor market sent a mixed signal. June payrolls rose just +57,000, well below consensus, with April/May revised down a combined 74,000. Unemployment fell to a 12-month-low 4.2%, but that’s mostly a shrinking labor force (participation down to 61.5%) rather than hiring strength. Meanwhile initial jobless claims fell to 187,000 — the lowest since 1969 — consistent with the “labor hoarding” pattern: employers aren’t hiring much, but they aren’t cutting either.The Fed is in the middle of its July 28–29 meeting as this is written, with a decision due Wednesday. Consensus expects the fifth straight hold at 3.5%–3.75%, but the committee remains genuinely split — several members have signaled openness to a hike given the oil-driven inflation risk, and markets are assigning roughly a one-third probability to a hike at this meeting and close to an 80% probability of one by September. New Chair Kevin Warsh has deliberately pulled back on forward guidance, which has left markets more on edge heading into each release than under the prior regime. The 10-year Treasury yield has moved up to around 4.65% and the 2-year to about 4.33%, both meaningfully higher than a month ago, as the combination of resurgent oil-driven inflation and a hawkish-leaning Fed repriced the curve.
Canadian Economy
Canada’s labor market cooled sharply after May’s blowout. Employment rose just 18,000 in June, a fraction of May’s 88,000, though unemployment still edged down to 6.5% as wage growth accelerated to 3.3% y/y — a sign the market isn’t slack enough to pressure pay. Worth noting on the per-capita front: Canada’s headline real GDP was flat in Q1 2026 (following a 0.2% annualized decline in Q4 2025), which sounds weak on its face. But on a per-capita basis, real GDP actually rose 0.2% in Q1 — because the population fell for a second straight quarter, so the same (or slightly smaller) economic pie is being split among fewer people. It’s the same theme we’ve flagged before: headline growth numbers understate the underlying resilience of the Canadian economy once you account for the shrinking non-permanent-resident population, and it supports the per-capita-consumption thesis even as top-line GDP and employment growth look sluggish.
Inflation brought real relief, for now. Headline CPI eased to 2.8% from May’s 3.2%, almost entirely on a 10.2% m/m drop in gasoline as the (since-collapsed) ceasefire briefly eased oil markets. More notably, the BoC’s core gauges — CPI-trim (1.8%) and CPI-median (1.9%) — fell below the 2% target for the first time in 2026, a shift from last month’s firming trend. But that ceasefire broke down in early July, so this deceleration is likely to reverse once higher pump prices show up in the July data. The BoC held rates at 2.25% on July 15 — a sixth straight hold — striking a more constructive tone on growth while flagging the Middle East conflict and US trade policy as the key risks. Next decision: September 2. We believe that the BOC will continue to hold as inflation in Canada has proven to be much more muted due to the macro conditions discussed.
Sector Performance
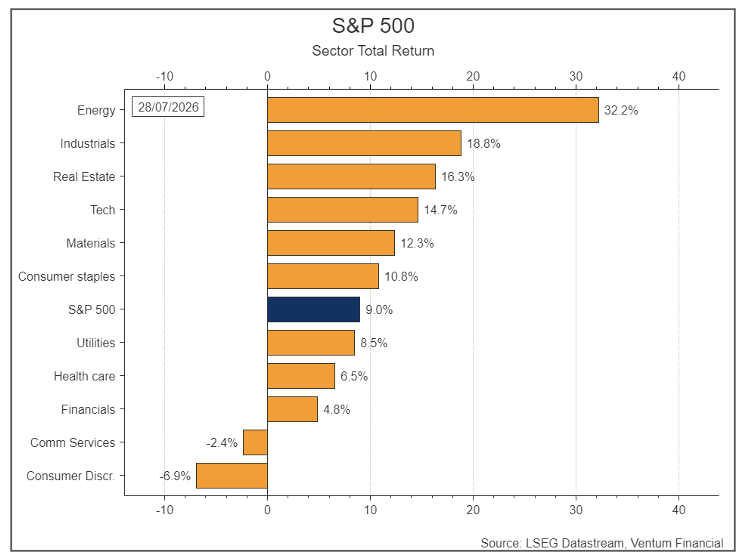
On the S&P 500, Energy is the runaway YTD leader at +32.2% total return, followed by Industrials (+18.8%), Real Estate (+16.3%), and Tech (+14.7%) — all comfortably ahead of the index’s +9.0%. Materials (+12.3%) and Consumer Staples (+10.8%) round out the winners. The laggards are Consumer Discretionary (-6.9%) and Communication Services (-2.4%), the only two sectors in the red, with Financials (+4.8%) and Health Care (+6.5%) also trailing the broader index.
Bond Market
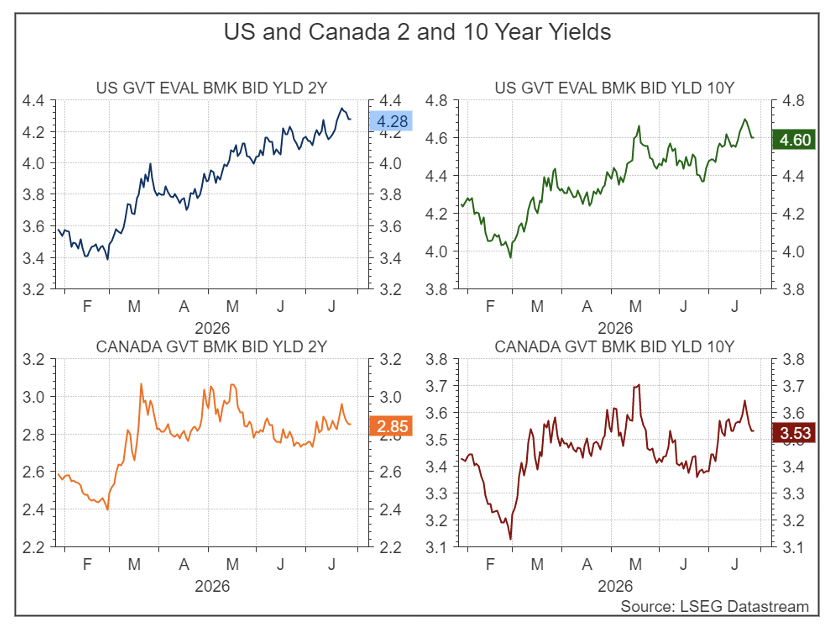
Yields have climbed on both sides of the border since June, but the gap between them has actually widened slightly. In the US, the 2-year sits at 4.28% and the 10-year at 4.60% — both well above June-end levels — as the oil shock and a hawkish-leaning Fed repriced the curve toward hikes rather than cuts. Canada’s curve moved up too, but from a lower base: the 2-year is at 2.85% and the 10-year at 3.53%, even with the BoC on hold and its own core inflation measures easing. The US 10-year now yields roughly 107bp more than Canada’s — a bit wider than June’s ~100bp gap — underscoring the same divergence we’ve flagged: a Fed leaning toward tightening against a BoC in no rush to move before September 2.
Currencies
The Japanese yen has been one of the worst-performing major currencies this year. The chart says a lot on its own: rebased to 1970, the yen’s real effective exchange rate is at 65.3 — cheaper, in trade-weighted, inflation-adjusted terms, than at any point in the post-1970 float era.
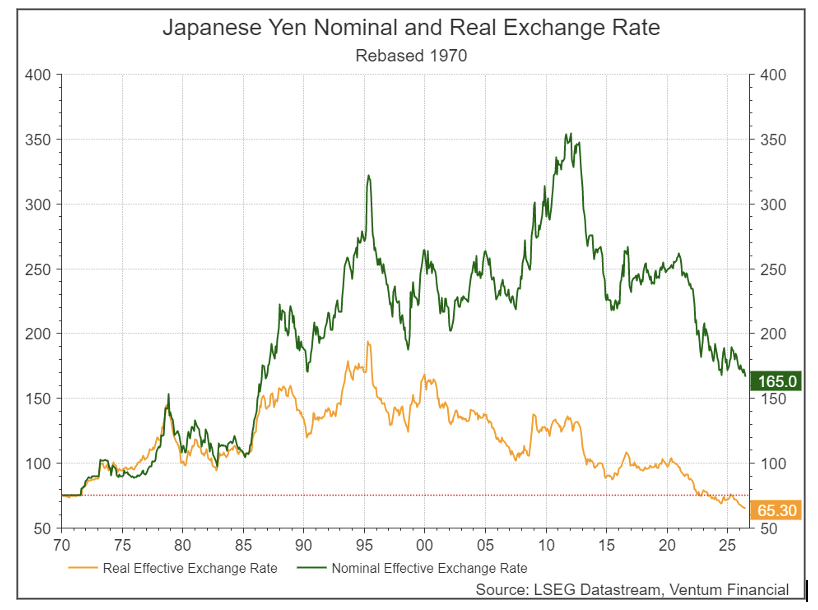
Higher energy prices have added a new wrinkle: to defend the yen, Japan has been funding intervention by selling US assets — roughly $72–73 billion worth over the past couple of months alone, per Ministry of Finance data. That matters for two reasons. First, Japan is the largest foreign holder of US Treasuries at around $1.1–1.2 trillion; if oil-driven yen pressure persists, further intervention means further unwinding of that position, adding supply pressure to the Treasury market. Second, it raises the stakes on a carry-trade unwind — for decades investors have borrowed cheaply in yen to fund purchases of higher-yielding US assets, a trade Yardeni pegs in the ballpark of $2–3 trillion. Rising JGB yields narrow that rate differential and make the trade less attractive, so a more aggressive BOJ risks triggering exactly the kind of rapid unwind that has rattled markets before.
Investment Strategy and Outlook
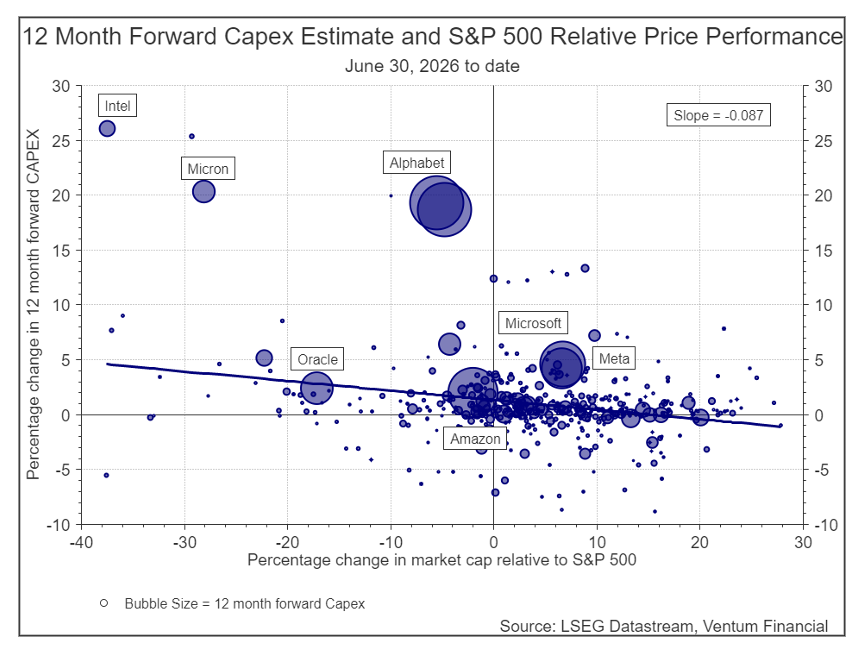
Since June 30, the US market has sold off on tech company capex worries: the relationship between rising 12-month forward capex and relative stock performance has turned sharply negative (slope of -0.087). Intel, Micron, and Alphabet — the names raising capex most aggressively — have been punished hardest, while Meta and Microsoft, also spending heavily, are yet to report for this quarter. It’s a reversal from April/May, when capex intensity was rewarded as a signal of AI leadership. Investors now seem focused less on how much companies are spending on AI and more on what return that spending will generate — a shift that lines up with the month’s other worries: circular AI financing, China’s resurgent AI and chip competition, and a less forgiving rate backdrop for long-duration growth names.
It’s worth keeping the recent pullback in perspective, though. Despite the sharp weekly drawdowns, Micron is still up roughly 187% YTD at time of this report, SanDisk around 361%, and Corning about 43% — this is profit-taking within an extraordinary run, not a collapse in the underlying AI-infrastructure thesis or growth. Valuations back that up: despite the sharp semis pullback, Tech Hardware & Equipment still trades near the top of its 10-year forward P/E range. That’s a tough setup heading into earnings, especially with all 11 S&P 500 sectors entering Q3 with positive EPS and revenue revisions (as we flagged in our July 13th note, “A Rare Clean Sweep”) — a rare, broad-based upgrade cycle that raises the bar. Simply meeting estimates likely won’t be enough to sustain current multiples; companies need to beat meaningfully. Combined with the murky macro backdrop and the midterm-election overhang, that’s keeping momentum investors on the sidelines rather than chasing the dip.
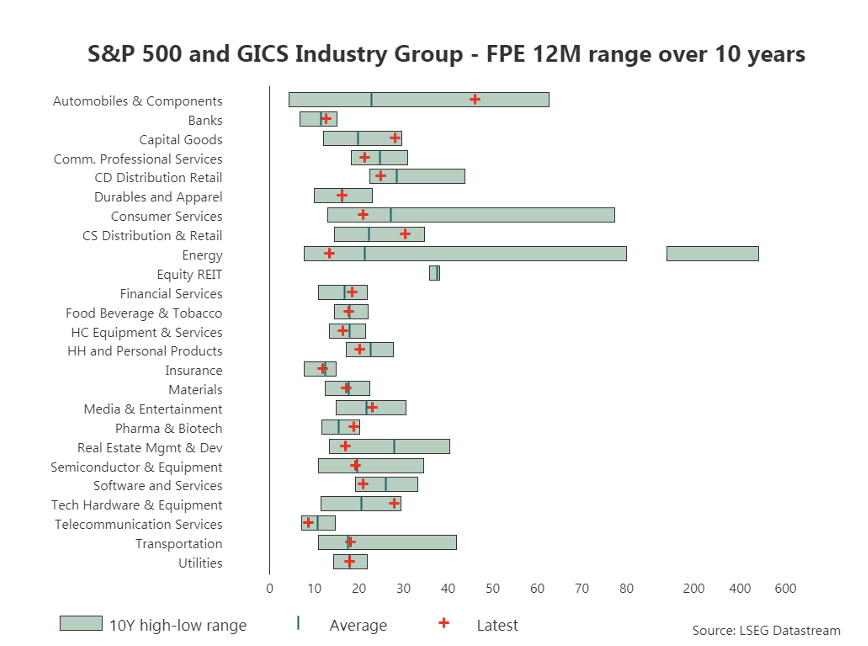
We’re maintaining the same sector preferences as last month — Information Technology, Industrials, Consumer Discretionary, and Financials over the medium term — but with a few caveats worth flagging. Tech hardware and Industrials have run hard enough that valuations, sentiment and the weaker technical trend now warrant some caution. The rate-sensitive sectors, including technology, more broadly deserve a closer look given where yields have moved this month; the “higher-for-longer, and possibly higher-still” repricing since early May cuts both ways for anything with duration in its cash flows.
Financials, in particular, have started seeing softer analyst revisions, which is worth watching given that sector’s dependence on a constructive credit and rate backdrop rather than just a steep curve. Record high Canadian bank valuations also warrant attention. The US/Iran/Israel war continues to be a major factor for the equity and bond markets. A read and durable ceasefire between the US and Iran would be a clear upside trigger — it would take the energy-driven inflation risk off the table and likely pull the Fed’s hiking bias back toward neutral — but given how quickly the last ceasefire unraveled, we wouldn’t hold our breath on that materializing anytime soon.
In Canada, we continue to like the banks over the medium term but record valuations could see near term weakness. Canada’s banks are all well-capitalized, which limits the kind of downside risk that elevated multiples might otherwise imply. On materials, we expect gold to hover around the $4,000 level for some time, assuming the macro picture doesn’t deviate too far from here — the metal has already round-tripped from its June low back to the mid-$4,000s as safe-haven demand ebbs and flows with the Iran conflict, and we don’t see an obvious catalyst to break decisively out of that range in either direction. Energy is more of a wild card: near-term price direction is hostage to how the Middle East situation evolves, but we’d note that companies focused on production volume rather than the price of the commodity itself are better positioned for multi-year gains as capex continues to pour into the sector — that’s a more durable tailwind than trying to call the next leg in oil prices.
Han Li . MA CFA
Bert Quattrociocchi, BA CFA
Discretionary Asset Management and Portfolio Strategy
© 2018-2023 Refinitiv. All rights reserved. Republication or redistribution of Refinitiv content, including by framing or similar means, is prohibited without the prior written consent of Refinitiv. Refinitiv and the Refinitiv logo are trademarks of Refinitiv and its affiliated companies.
Ventum Financial Corp. www.ventumfinancial.com
Vancouver Office
2500 – 733 Seymour Street
Vancouver, BC V6B 0S6
Ph: 604-664-2900 | Fax: 604-664-2666
For a complete list of branch offices and contact information, please visit our website.
Participants of all Canadian Marketplaces. Members: Canadian Investment Regulatory Organization, Canadian Investor Protection Fund and AdvantageBC International Business Centre – Vancouver. Estimates and projections contained herein are our own and are based on assumptions which. we believe to be reasonable. Information presented herein, while obtained from sources we believe to be reliable, is not guaranteed either as to accuracy or completeness, nor in providing it does Ventum Financial Corp. assume any responsibility or liability. This information is given as of the date appearing on this report, and Ventum Financial Corp. assumes no obligation to update the information or advise on further developments relating to securities. Ventum Financial Corp. and its affiliates, as well as their respective partners, directors, shareholders, and employees may have a position in the securities mentioned herein and may make purchases and/or sales from time to time. Ventum Financial Corp. may act, or may have acted in the past, as a financial advisor, fiscal agent or underwriter for certain of the companies mentioned herein and may receive, or may have received, a remuneration for their services from those companies. This report is not to be construed as an offer to sell, or the solicitation of an offer to buy, securities and is intended for distribution only in those jurisdictions where Ventum Financial Corp. is registered as an advisor or a dealer in securities. Any distribution or dissemination of this report in any other jurisdiction is strictly prohibited.
For further disclosure information, reader is referred to the disclosure section of our website.