
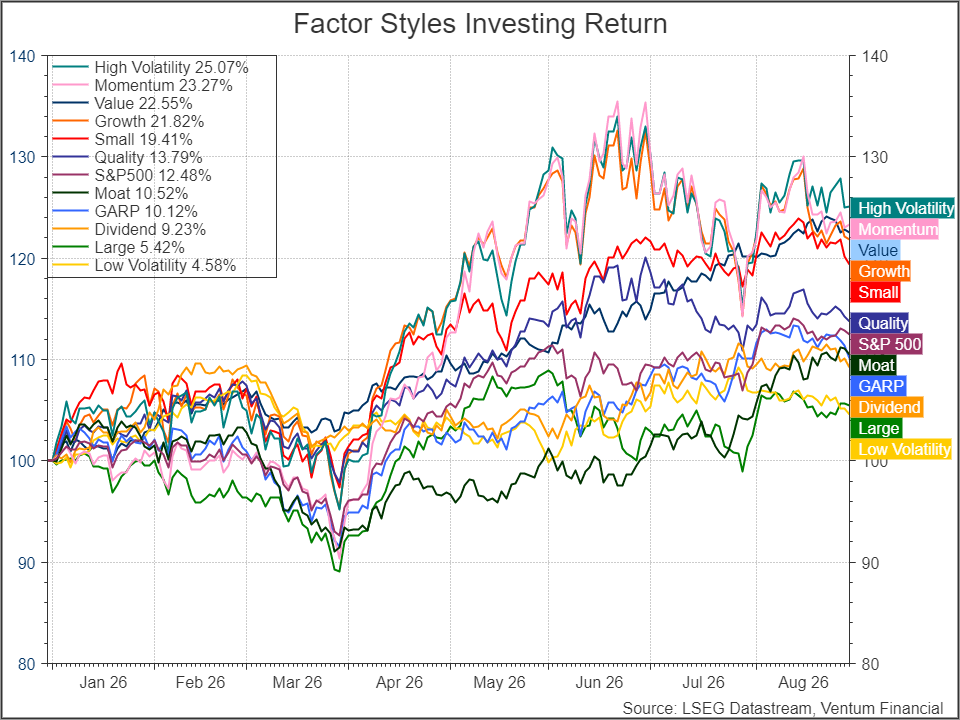
For most of the last few years, value investing was where money went to underperform — a strategy investors defended on principle while growth and momentum quietly ran away with the returns. However, the picture in 2026 looks much different, and the trigger wasn’t a valuation reckoning so much as a war. Ongoing conflict in the Middle East and elevated energy prices have been pushing yields higher all year, and the Fed has responded by holding firm rather than cutting. US Fed Chair Kevin Warsh — in just his second meeting since taking the helm in June — described the internal debate as a “good family fight,” even as three dissenters pushed for an immediate hike. Those dissents have shifted market expectations toward a possible move at the September meeting instead, and more broadly, investors have moved from pricing in rate cuts earlier in the year to pricing in the possibility of further hikes by year-end. Against that backdrop, factor-style leadership has begun tilting toward value for the first time in years: the chart shows High Volatility and Momentum, the two strongest performers through early summer, flattening and giving back some relative strength from roughly June onward, while Value — long the market’s perennial laggard — has held its gains more steadily through August. That shift lines up with the historical pattern of value outperforming in higher-rate, higher-inflation regimes, since value companies are shorter-duration assets that generate a greater share of their profits sooner and are therefore less exposed to rising discount rates than higher-beta, more speculative names.
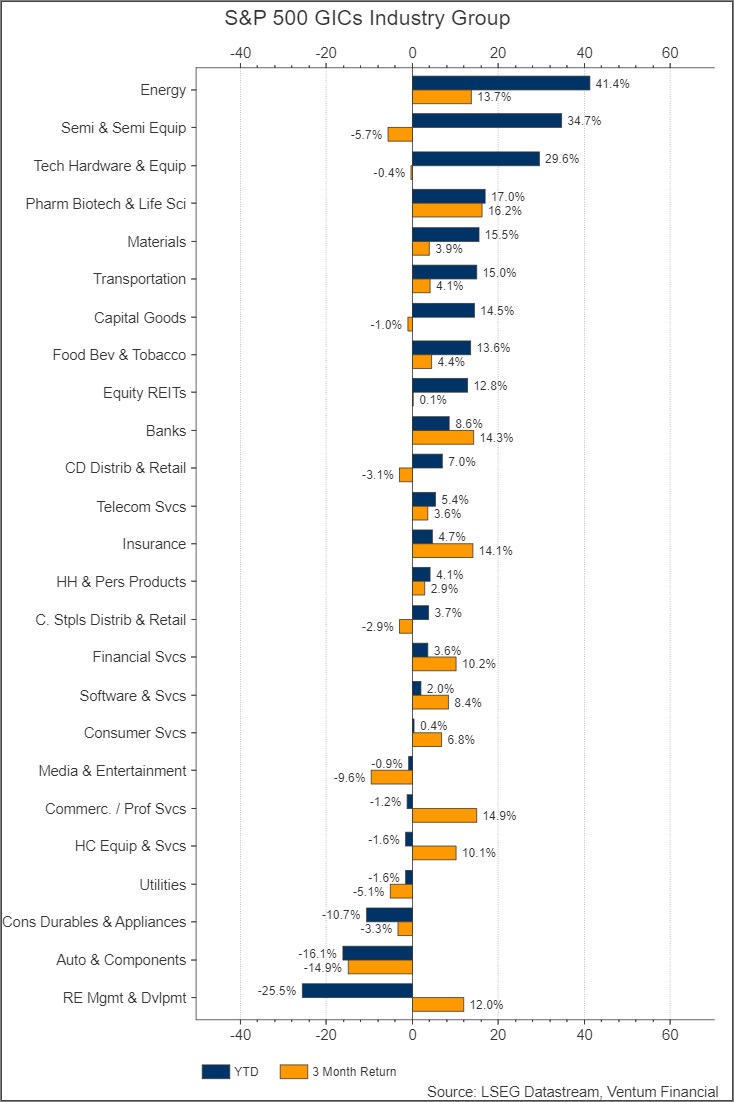
Sector data tells the same story with more texture. Energy remains the year’s standout, up 41.4% YTD and still adding 13.7% over the past three months — the clearest beneficiary of the oil-and-conflict dynamics driving the broader rate narrative. But several other top YTD performers have visibly cooled: Semiconductors & Semi Equipment, up 34.7% YTD, actually lost 5.7% over the past three months, while Tech Hardware (+29.6% YTD) and Capital Goods (+14.5% YTD) slipped modestly too. The sectors that carried the market’s YTD numbers are no longer carrying its momentum. Meanwhile, defensive sectors that lagged most of the year have snapped back hard: Insurance, up just 4.7% YTD, gained 14.1% in the past three months alone, and Pharma, Biotech & Life Sciences added a further 16.2% on top of an already-strong year. Software & Services tells a similar story — a modest 2.0% YTD gain has been almost entirely built in the last quarter, with an 8.4% three-month return doing the heavy lifting.
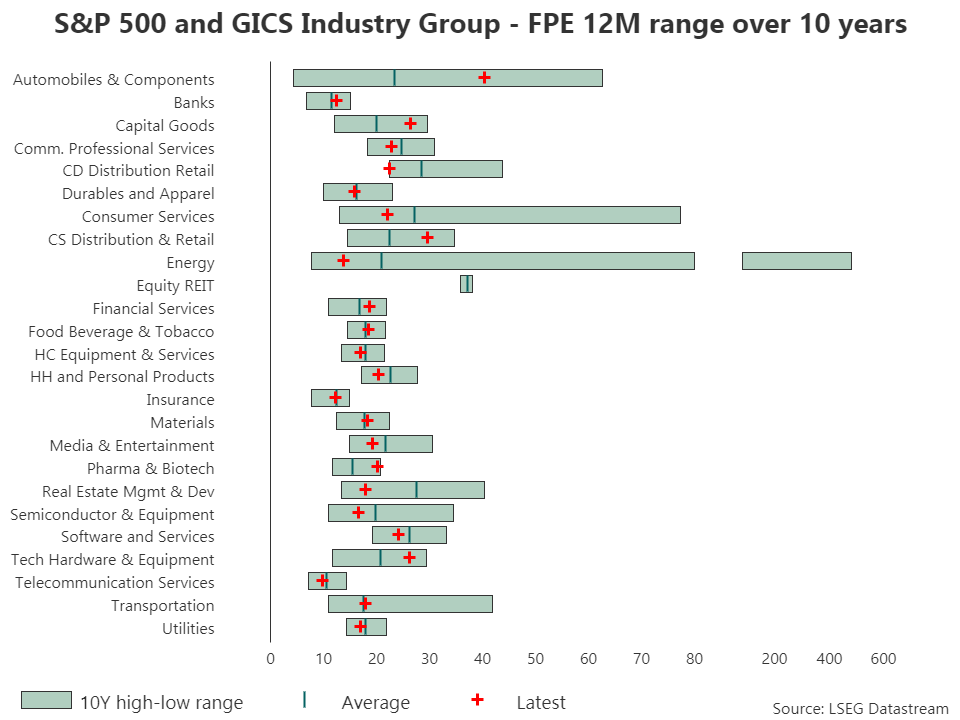
Underlying this rotation is a simple pattern: the last three months looked less like a broad flight to quality and more like investors specifically bidding up this year’s laggards — buying names cheap relative to their own historical valuation ranges rather than chasing further strength in the winners. That distinction holds up when you look at where sectors sit within their 10-year multiple range. Software & Services, after lagging for most of 2026, still trades below its historical average — genuinely cheap by its own history, which helps explain the recent buying interest. Tech Hardware tells the opposite story: even after its pullback, it’s still trading above its 10-year average, meaning the recent decline mostly worked off some excess rather than making the sector actually cheap.
How long this trend persists is an open question. The Info Tech sector is currently expected to grow earnings more than 40% over the next 12 months, with virtually every subsector — including software — priced for handsome rewards if that materializes. AI disruption is still an active, unresolved force, and investor sentiment could turn quickly if the earnings story falters. But our view is that the value rotation has more room to run as long as yields stay elevated: many software names still trade below their long-term multiples, and elevated yields are precisely the environment that keeps investors anchored to cheaper, shorter-duration names rather than chasing growth.
Several structural factors could keep yields anchored at these elevated levels for longer than the market currently expects:
1. War in the Middle East and energy costs. Brent crude is trading around $95/barrel, pushing up input costs economy-wide and keeping inflation expectations elevated.
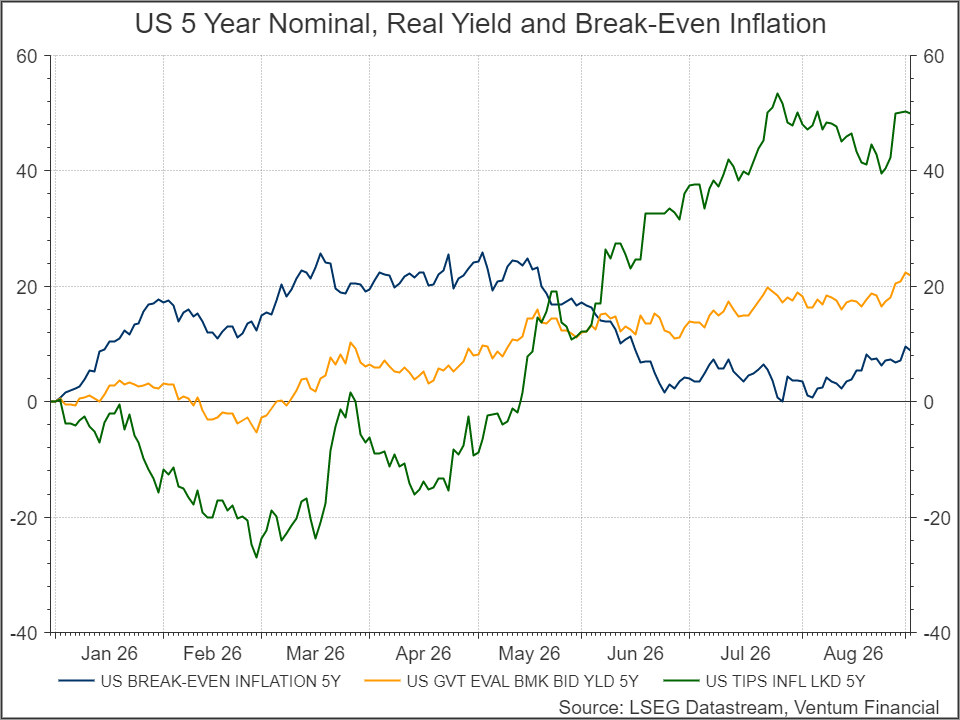
2. Underlying growth remains genuinely strong. Employment and consumer spending have stayed resilient, unemployment is low, and household wealth sits at all-time highs. Tellingly, during the brief Middle East ceasefire in April/May, break-even inflation fell but nominal yields held up — because real yields rose to offset it, evidence that the move was about strong underlying growth rather than inflation fears alone. The Atlanta Fed’s GDPNow estimate currently points to 4.7% growth this quarter.
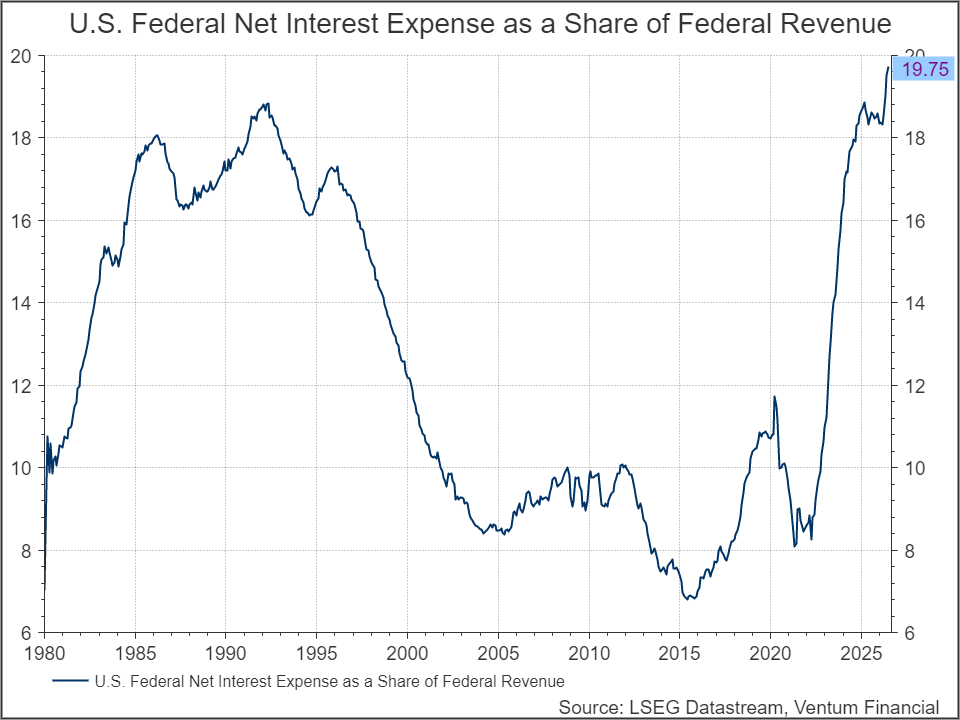
3. Fiscal sustainability concerns. U.S. federal net interest expense has climbed to nearly 20% of federal revenue (19.75%), a level not seen since the high-rate era of the late 1980s/early ’90s, and investors are increasingly pricing in long-term debt sustainability risk.
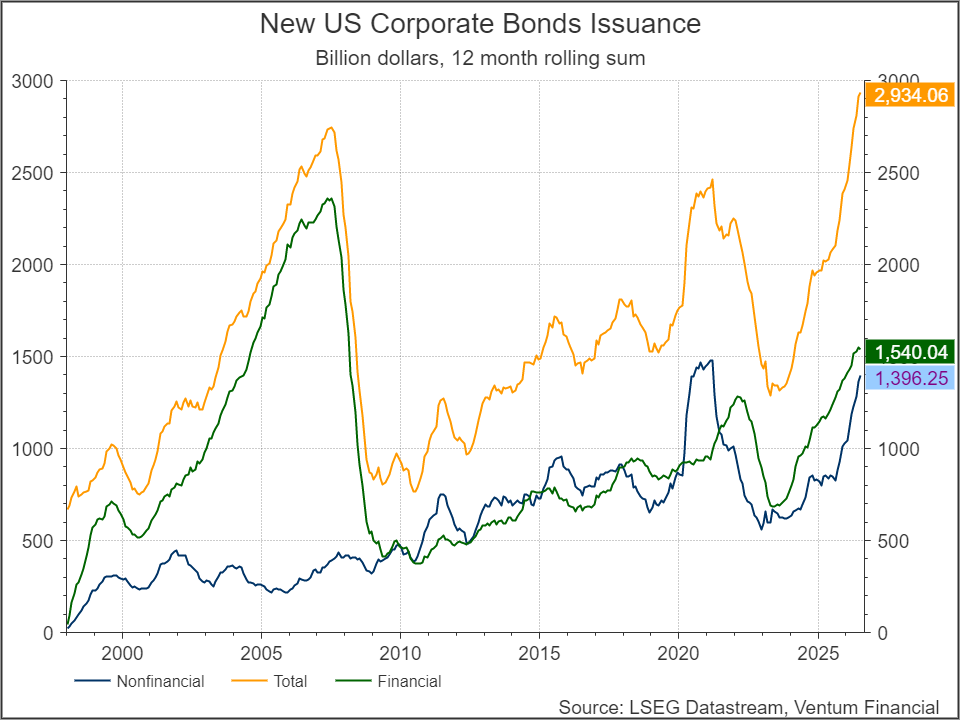
4. AI capex and record corporate debt issuance. New U.S. corporate bond issuance has reached almost $3 trillion on a 12-month rolling basis — more than double 2024’s pace — as AI-related capital spending gets funded in the debt markets. That surge in supply, concentrated in longer-dated paper, is crowding out demand for Treasuries at the same maturities.
5. The “Warsh premium.” Chair Warsh has reiterated the Fed’s commitment to bringing inflation back to target, but the mechanism remains unclear — a policy rate hike, balance sheet runoff, or some combination — and that uncertainty arguably deserves a term premium of its own, though we don’t yet see clear evidence of it showing up in the term premium data itself. So we write this point with an asterisk.
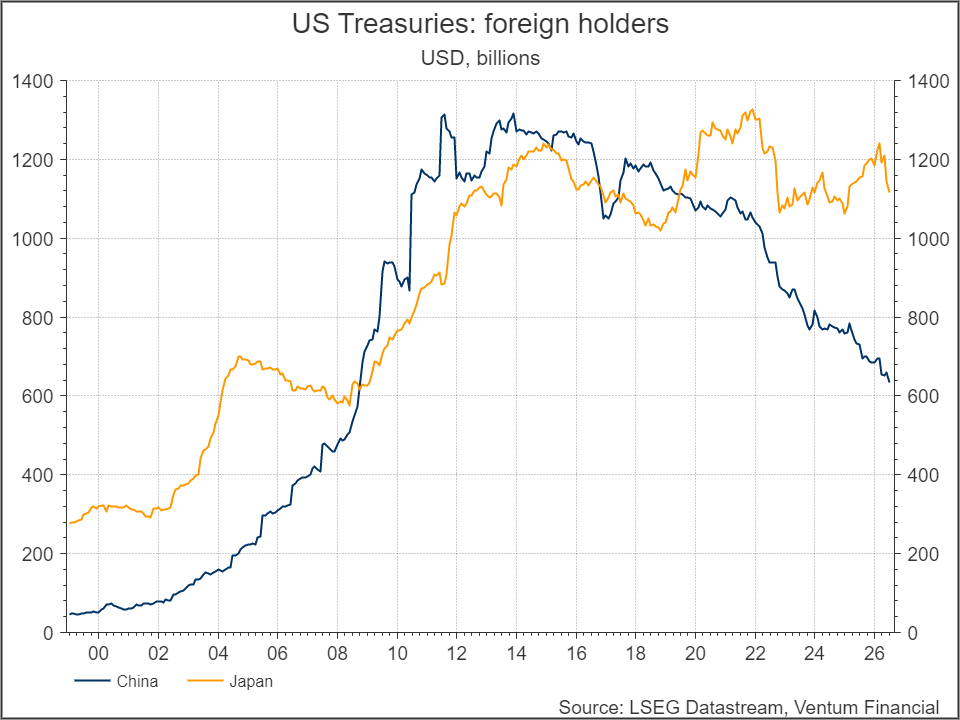
6. Japan as a swing factor. A sluggish Japanese economy, government energy subsidies at a moment of high import costs, mounting fiscal concerns, and a weakening yen have put the Bank of Japan on a path of selling U.S. Treasuries to defend the currency. The unwinding of carry trade adds another source of Treasury supply just as domestic issuance is already elevated, a headwind for any near-term decline in yields.
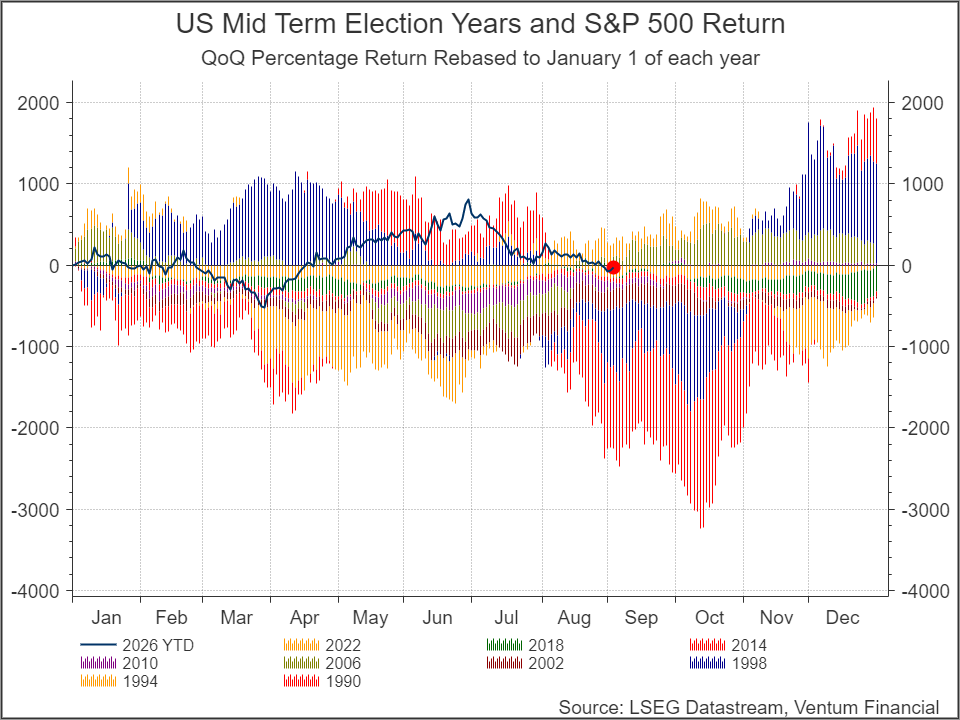
Looking ahead, we expect heightened volatility as the market moves closer to the midterm elections. Prediction markets currently assign an 80% chance of Democrats retaking the House, while the Senate remains a coin flip — and with the war in Iran deeply unpopular and Trump’s approval rating at its lowest point yet, political turmoil looks like a real possibility on top of the usual electoral uncertainty. Earnings forecasts remain strong across all 11 sectors, but we see signs that analyst revisions have run ahead of what’s actually being reported, leaving room for disappointment. Seasonality adds another headwind: September has historically been a weak month for equities, and looking at past midterm election years, the worst stretch tends to fall around mid-October. Taken together, we think markets may be more volatile in the weeks ahead investors should stay cautious in the near term.
Han Li . MA CFA
Bert Quattrociocchi, BA CFA
Discretionary Asset Management and Portfolio Strategy
© 2018-2023 Refinitiv. All rights reserved. Republication or redistribution of Refinitiv content, including by framing or similar means, is prohibited without the prior written consent of Refinitiv. Refinitiv and the Refinitiv logo are trademarks of Refinitiv and its affiliated companies.
Ventum Financial Corp. www.ventumfinancial.com
Vancouver Office
2500 – 733 Seymour Street
Vancouver, BC V6B 0S6
Ph: 604-664-2900 | Fax: 604-664-2666
For a complete list of branch offices and contact information, please visit our website.
Participants of all Canadian Marketplaces. Members: Canadian Investment Regulatory Organization, Canadian Investor Protection Fund and AdvantageBC International Business Centre – Vancouver. Estimates and projections contained herein are our own and are based on assumptions which. we believe to be reasonable. Information presented herein, while obtained from sources we believe to be reliable, is not guaranteed either as to accuracy or completeness, nor in providing it does Ventum Financial Corp. assume any responsibility or liability. This information is given as of the date appearing on this report, and Ventum Financial Corp. assumes no obligation to update the information or advise on further developments relating to securities. Ventum Financial Corp. and its affiliates, as well as their respective partners, directors, shareholders, and employees may have a position in the securities mentioned herein and may make purchases and/or sales from time to time. Ventum Financial Corp. may act, or may have acted in the past, as a financial advisor, fiscal agent or underwriter for certain of the companies mentioned herein and may receive, or may have received, a remuneration for their services from those companies. This report is not to be construed as an offer to sell, or the solicitation of an offer to buy, securities and is intended for distribution only in those jurisdictions where Ventum Financial Corp. is registered as an advisor or a dealer in securities. Any distribution or dissemination of this report in any other jurisdiction is strictly prohibited.
For further disclosure information, reader is referred to the disclosure section of our website.