
Canadian and US Economy: Both the US and Canadian economies are growing at a decent pace, with resilient labor markets and consumption holding up. Canada’s headline growth and employment numbers screen weaker, but that largely reflects a shrinking population as temporary residents leave — on a per-capita basis the picture is far more resilient, supported by wage growth still running in the 3–4% range.
Equity Markets: Equity markets rolled over from their late-May highs as solid economic growth pushed real yields higher, pressuring the long-duration tech and AI names that had led all year. The result was a clear rotation into value and quality at the expense of growth and momentum.
Bond Market: Bond yields tell a tale of two economies: US yields have ground higher across the curve as a hawkish Fed and firmer growth push real rates up, while Canadian yields sit well below as slower growth and a more contained, largely energy-driven inflation backdrop give the Bank of Canada little reason to move. The result is a wide, persistent gap — the US 10-year now yields roughly 100bp more than its Canadian counterpart — that reflects rising yields being far less of a concern in Canada than in the US.
Currencies and commodities: The US dollar has been broadly firm this year, lifted by a hawkish Fed and higher real yields that continue to draw capital in. The Canadian dollar has weakened against it, and the pressure has deepened recently: with the war winding down and energy prices falling — plus higher US real yields driving gold sharply lower — the loonie lost two of its key commodity supports at once.
Portfolio Strategy: We remain positive on US and Canadian equities over the medium term, supported by resilient economic growth and an earnings backdrop that continues to surprise to the upside. That said, with valuations stretched and consensus targets only modestly above current levels, we see near-term risk skewed to the downside due to weaker energy and gold prices. We favor sectors positioned for a higher-real-yield, solid-growth environment — Financials, which benefit from a steeper curve and wider margins, and Information Technology and Industrials for their revenue and earnings growth thanks to surging AI buildout — while leaning into the rotation toward value and quality at the expense of the most crowded, long-duration growth names.
Equity Markets
The momentum reversed this month. After pushing to fresh record highs in late May, equities rolled over through June as the U.S.–Iran back-and-forth gave way to a sharper, more market-moving story: a hawkish Fed and a violent unwind in the high-flying technology and AI complex. The leadership that had carried the market all year became the source of its weakness.
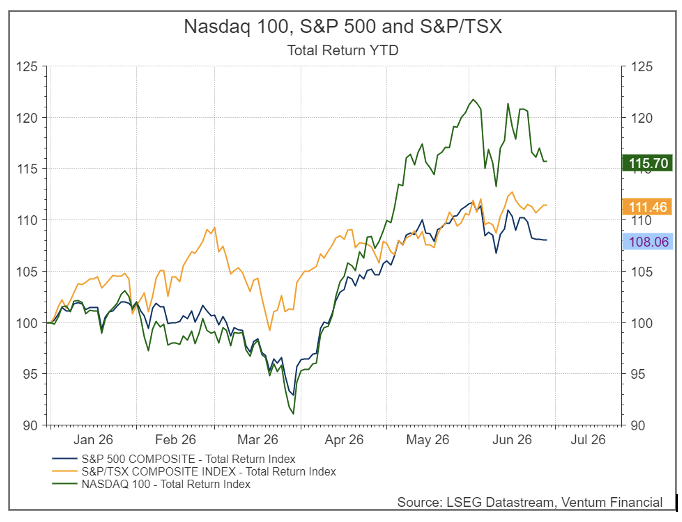
Year-to-date the major indices are still firmly positive — the Nasdaq-100 leads at +15.70%, the S&P/TSX Composite is up +11.46%, and the S&P 500 trails at +8.06% — but the shape of the chart tells the real story: all three peaked around late May and have given back ground since, with the Nasdaq-100 falling hardest from its ~122 high as the AI trade came under pressure.
The factor leaderboard captures the rotation now underway. For the year as a whole, the high-beta growth trio still sits on top — Momentum +29.23%, High Volatility +28.66%, and Growth +25.84% — a legacy of the AI-led melt-up that ran from April into late May. But that ranking is backward-looking; the more important signal is in the recent turn. Since the late-May peak, those same three leaders have rolled over the hardest, precisely because they are the factors most loaded with the crowded AI and mega-cap technology names that came under pressure this month.
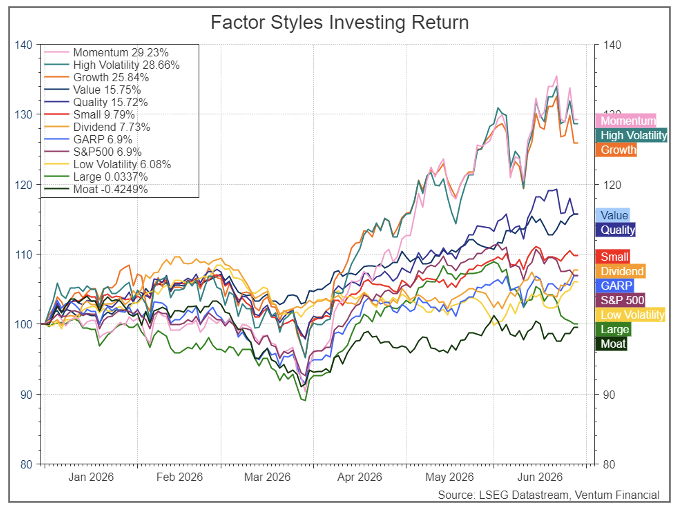
What has held up, and kept grinding higher into June, is the other end of the style spectrum: Value (+15.75%) and Quality (+15.72%) have continued to climb even as the high-fliers fell. This is the rotation in microcosm — investors trimming the expensive, momentum-driven AI complex and redeploying into cheaper, more durable cash-flow names. It fits the macro backdrop we’ve laid out: with real growth in the economy holding up (solid GDP, a resilient labor market, firm consumption) and real yields pushing higher, the case for paying any price for long-duration growth weakens, while value and quality — which benefit from a steady, higher-nominal-growth, higher-rate environment — become relatively more attractive.
US Economy
The US economy continues to grow at a solid pace. The most recent reading from the Atlanta Fed’s GDPNow model points to 2.5% real GDP growth (SAAR) for Q2 2026 as of its June 25 update. That is a meaningful step down from the quarter’s peak of 4.3% on May 21, with the model bouncing around in the 2.8%–3.3% range through most of June before settling lower. The downshift reflects two main forces: inflation running hotter than expected on the back of elevated energy prices and the Middle East conflict, and a large negative drag from net exports. Strip those out and the underlying picture is still one of a healthy expansion — current growth sits right at the upper end of the 2–3% pace that prevailed in the years before the pandemic.
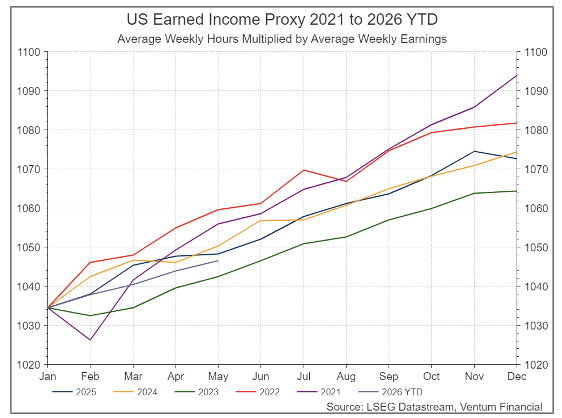
Under the hood, the labor market remains resilient. The unemployment rate held at 4.3% in May, where it has sat in a narrow 4.3%–4.5% band since July 2025. Payrolls have held up better than feared, with 172,000 jobs added in May and upward revisions to both March and April. Initial jobless claims came in at 215,000 for the week ending June 20, down 12,000 on the week, with the four-week average around 224,000 — still among the lowest levels of the past two years, and continuing claims remain subdued. Our thesis from the start of the year — that the employment market remains stable — therefore stays intact. The earned income proxy, which multiplies average weekly hours by average weekly earnings, shows trend growth essentially indistinguishable from the past five years, confirming that earnings, and by extension nominal consumption, are holding up.
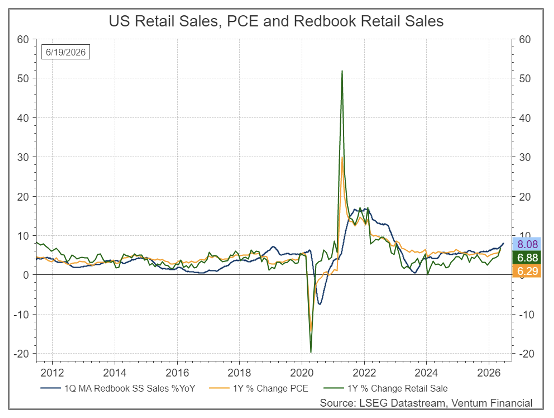
Consumer spending, which historically drives roughly two-thirds of GDP, looks firm across every metric we track. Redbook same-store sales, headline retail sales, and PCE all point in the same direction: spending is trending higher and sits near multi-decade highs in nominal terms.
Consumer sentiment has clawed back some ground. The University of Michigan index rose to a final 49.5 in June, up from May’s record low of 44.8, snapping a three-month run of declines. The rebound is best attributed to lower-income consumers, who benefited most from the moderation in gasoline prices as the fragile Iran ceasefire held — gas is a larger share of their budgets. The improvement was real but modest: at 49.5 the index is still the second-lowest reading on record going back to the 1970s and remains well below the 60.7 of a year ago. The squeeze hasn’t lifted — for the third straight month, over half of consumers spontaneously cited high prices as weighing on their finances.
The wrinkle is that lower-income households are still bearing the brunt of the inflation pressure. The Conference Board’s breakdown by income group shows higher-income consumers — and, by proxy, those with greater household wealth — faring better, supported by a strong stock market. The bottom income cohorts continue to lag.
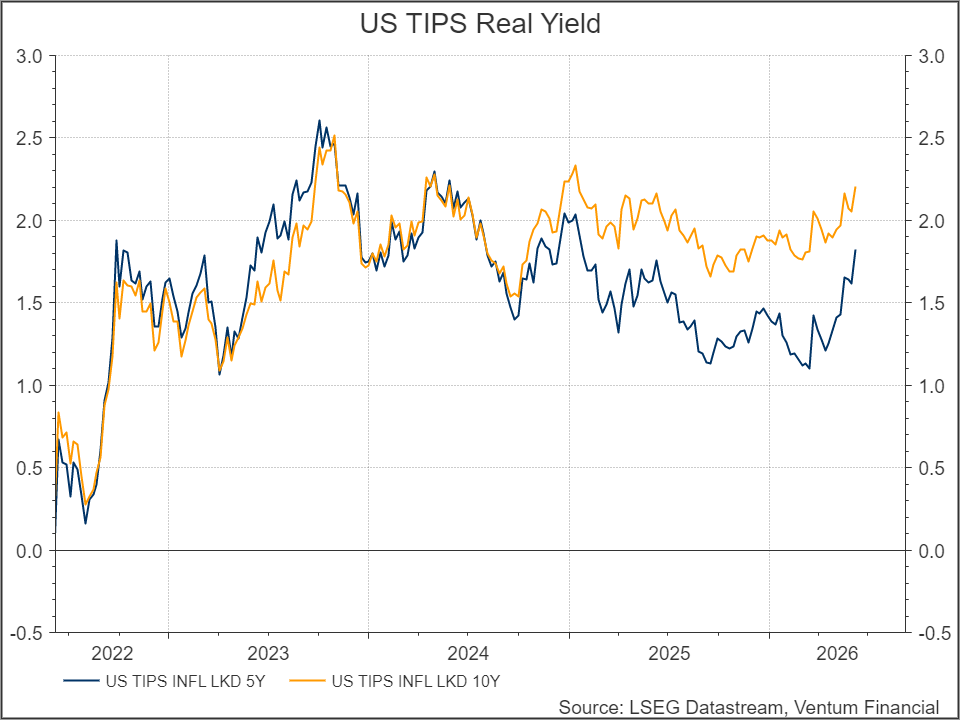
Our core thesis — that the US economy is in solid shape — remains on track. The one thing to watch is the bond market’s reaction to the war winding down. As the Middle East conflict de-escalated and oil prices began to climb back down, nominal yields have barely budged. The interpretation: the firmer consumer confidence is unleashing fresh demand, and you can see it in real yields. Even as inflation expectations have come down — Michigan’s long-run measure fell back to 3.3% and the year-ahead reading eased to 4.6% — real yields have pushed sharply higher. The 5-year TIPS real yield is now around 1.8–1.9%, having risen roughly 50bps since the start of the year (it was about 1.33% at the May 1 reset and has jumped close to 60bps in the two months since) and now sits just shy of its two-year highs.
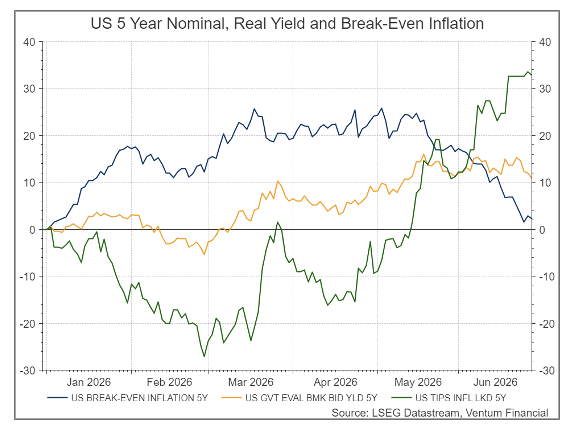
Kevin Warsh’s first FOMC meeting as Fed Chair, on June 17, confirmed our view that interest rates are more likely heading up than down. The Committee held the federal funds target range at 3.5%–3.75% for the fourth straight meeting, but the message around it turned decisively hawkish. The market is now pricing in 1 hike by the US Federal reserve in the next 12 months.
Canadian Economy
Canada’s employment picture is far more volatile than its US counterpart. The unemployment rate ticked down to 6.6% in the most recent print, a 0.3-point drop from 6.9% the month before, as the economy added 88,000 jobs — the strongest monthly gain since December 2024 and well above the 10,000 consensus. But the headline flatters the underlying picture: total employment is still up only 0.7% over the past year and remains down roughly 24,000 positions year-to-date, and the gain followed a cumulative loss of 112,000 net jobs over the first four months of 2026. The rockiness is felt most in provinces such as Ontario and BC, where the temporary-worker and foreign-student populations are largest, and where the unwinding of those cohorts shows up first in the data.
The demographics are the through-line. Canada’s latest population estimate marked its third consecutive quarter of decline, with the population falling about 0.1% (~55,000 people) in Q1 2026 to 41.4 million. The driver is the exodus of non-permanent residents: temporary residents fell by roughly 118,000 in the quarter, a 4.4% drop, taking them to 2.56 million, or 6.1% of the population — down from a peak of 3.15 million (7.6%) in late 2024. Permanent admissions also slowed, down 20.2% year-over-year.
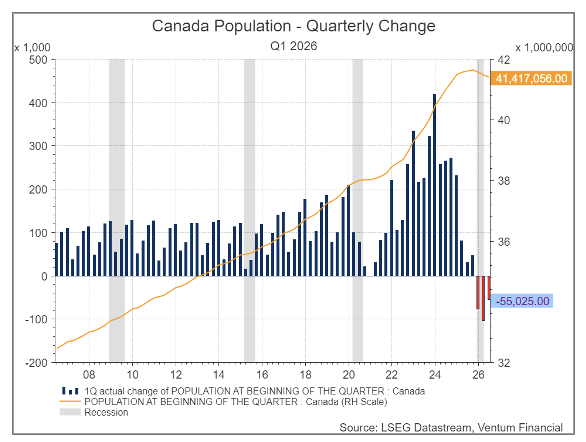
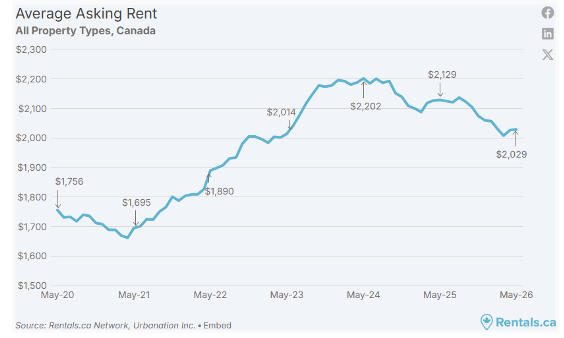
This is the trend our February report flagged via the CBC piece estimating that roughly 3 million temporary working visas will expire across 2025–2026, with only about half expected to be renewed. The Q1 data is consistent with that path: Ottawa is targeting a temporary-resident share of 5% by the end of 2027, and analysts project the population could keep falling through 2027. The implication for the labor market is important and supports our thesis — as National Bank pointed out, flat employment in a shrinking population suggests “job market slack has stopped accumulating,” and per-capita GDP growth actually remained positive in Q1. The same demographic drag continues to depress average asking rents, mirroring the population trend.
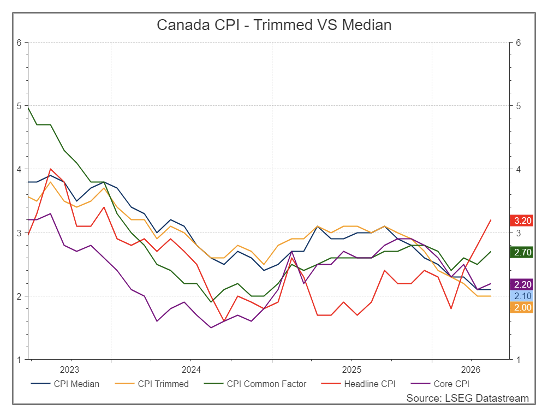
On inflation, the latest print shows the divergence we’ve been expecting: headline is climbing on energy while core firms up underneath. Headline CPI rose to 3.2% in May, a 29-month high, up from 2.8% in April and ahead of the 3.0% consensus, driven almost entirely by gasoline, up 33.2% year-over-year on the Middle East oil shock. Stripping out gas, CPI was a tamer 2.2%. The Bank of Canada’s core measures have started to firm — CPI-median at 2.1% and CPI-trim at 2.0%, steady on the month but now running above 2% on a three-month annualized basis. Acting as the counterweight is disinflation in shelter: shelter CPI rose just 1.7% year-over-year in May (down from 1.8% in April), held down by a 13th straight monthly decline in homeowners’ replacement cost and a 33rd consecutive month of deceleration in mortgage interest costs. That 1.7% sits comfortably below the BoC’s 2% target and continues to mirror the soft population/rent dynamic.
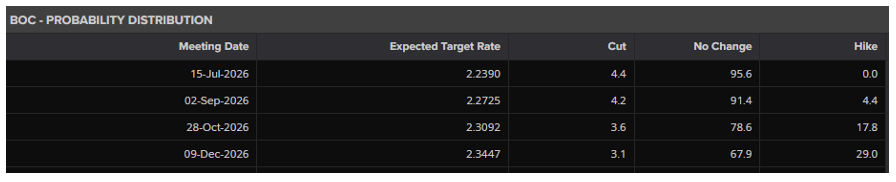
The Canadian economy remains in a bit of a soft patch. Headline growth and employment numbers may stay soft as the population shrinks, and the jobs data will keep looking weak for the same reason. But per-capita consumption should stay resilient: wage growth, while it cooled to 3.0% year-over-year in May from 4.5% in April, is still running in the 3–4% range that has held near the highs of the past two decades. This has been our thesis since the start of the year, and the per-capita lens is exactly why we’re more constructive than the headline suggests. On policy, the market has walked back its bets on the BoC hiking by year-end, down from the one hike some forecasters had penciled in earlier this year. The consensus now is that BOC will hold until year-end.
Sector Performance – Tech continues to lead
For the S&P 500, June was a textbook defensive rotation. With the index itself down 2.9% on the month, money moved out of growth and into safety. The three leaders were all defensive or rate-sensitive. Health care led at +7.8%, the best of the eleven sectors, Industrials (+5.0%) and utilities (+4.8%) rounded out the top three; utilities in particular is the classic bond-proxy defensive investors reach for when de-risking.
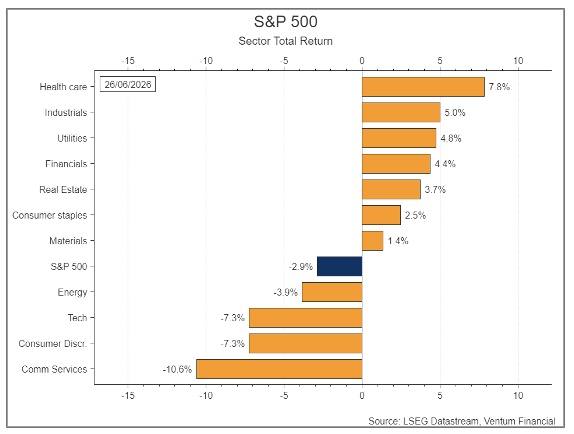
The laggards tell the other half of the story. Communication services was the worst at −10.6%, with tech and consumer discretionary both down 7.3%. This was the AI/growth complex unwinding over the month: the Nasdaq fell 4.6% in the final week alone as investors rotated out of technology into defensives, with chip stocks hit by concerns over the sustainability of hyperscaler AI infrastructure spending, amplified by a report that OpenAI may delay its IPO. Because comm services is now extremely top-heavy — nearly half of the sector sits in just two mega-cap names — any wobble in those stocks drags the whole sector, which is why it underperformed even tech. Consumer discretionary fell for a related reason: it’s sensitive to mega cap names Amazon and Tesla and exposed to any pullback in these 2 names, so it sold off alongside other Mag 7.
The S&P/TSX held up far better, up 0.8% on the month versus the S&P’s −2.9%, precisely because its composition is so different — less tech, more defensives and financials. The top three were consumer staples (+11.1%), the TSX banks subindex (+9.0%), and financials (+7.5%). Staples leadership echoes the same defensive impulse seen south of the border, with a Canadian flavor: Alimentation Couche-Tard posted a record Q4, with net earnings nearly doubling year-over-year. Financials and the banks were supported by the back-up in bond yields through June — steeper curves and higher-for-longer rates help bank net interest margins — and by resilient credit.
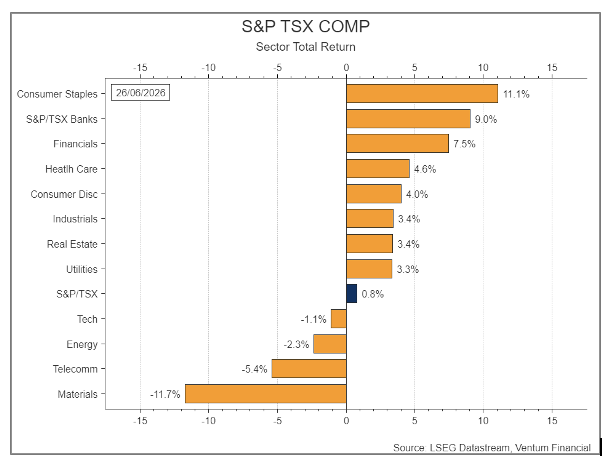
The two clear laggards were materials (−11.7%, the worst sector) and telecom (−5.4%). Materials is the most notable divergence, and it’s a precious-metals story in reverse. Materials had been one of the TSX’s two big leadership sectors all year, tied to record gold prices. In June that reversed: as the US–Iran ceasefire eased safe-haven demand and the US dollar firmed, gold pulled back, hitting the sector’s gold-mining heavyweights hardest and unwinding a chunk of the year’s gains in a single month. Telecom’s −5.4% mirrors the pressure on US comm-services names and reflects the drag that higher bond yields put on these debt-heavy, dividend-paying stocks — when yields rise, their dividends look less attractive relative to bonds.
Bond Market
The two curves tell opposite stories, and the contrast reinforces our core view: rising yields are a smaller problem for Canada than for the US. South of the border, yields have ground higher across the curve as the Fed turned hawkish — the 2-year sits at 4.09% and the 10-year at 4.37%, with the front end doing most of the work after the hawkish start to Warsh’s Fed and the dot plot’s shift toward a hike. That’s a market pricing out cuts and leaning toward higher-for-longer.
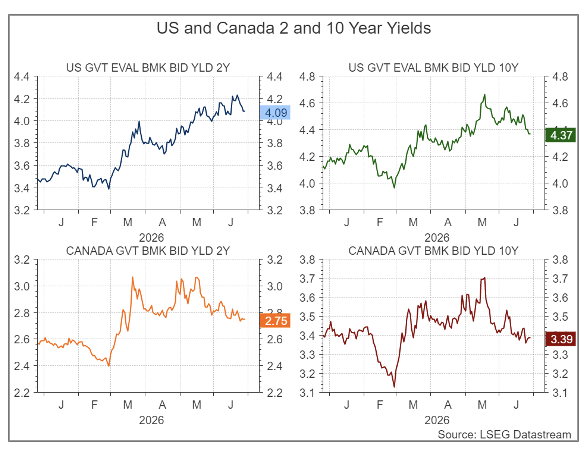
Canada’s curve sits far lower and reflects a softer, more disinflationary backdrop. The 2-year is at 2.75% and the 10-year at 3.39% — the latter the lowest in over three months — as benign core inflation backed expectations that the Bank of Canada will hold this year. With inflation looking more transitory in Canada (energy-driven headline, soft core) and headline GDP growth slower, the BoC has far less reason to push rates up, so the upward pressure on Canadian yields is more contained. The result is a wide, persistent gap: the US 10-year yields roughly 100bp more than its Canadian counterpart, with an even larger spread at the front end — a Fed leaning hawkish against a BoC that may not move until 2027.
Currencies
The US dollar has been broadly firm, with the DXY up 3.1% year-to-date as the hawkish Fed and higher real yields drew capital in. Against that strong dollar, most major currencies have lost ground YTD — the biggest decliners include the Indian rupee (−5.0%), the Canadian dollar (−3.4%), and the yen and euro (both −3.2%). The notable gainers are the offshore and onshore yuan (both up ~2.5–2.8% vs USD), supported as China rotated out of US assets during this year’s energy-price shock.
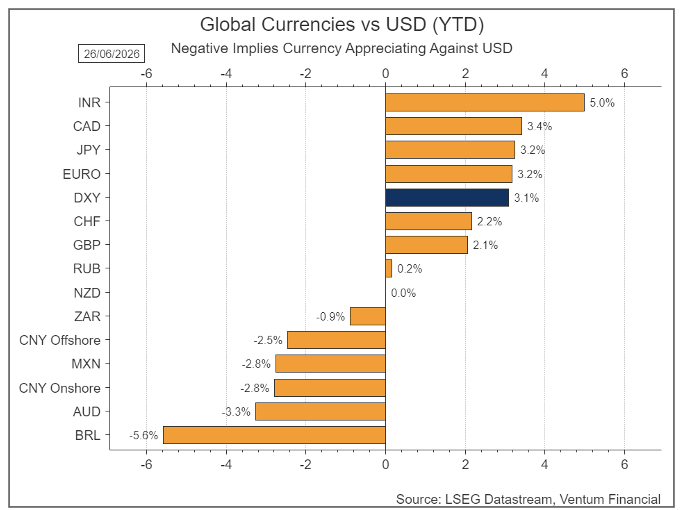
CAD’s weakness has deepened recently: with the war winding down and energy prices falling, plus higher US real yields driving gold sharply lower — gold broke below $4,000 for the first time in 2026 — the loonie lost two of its key commodity supports at once. The yen is squarely in the danger zone: it just slid to its weakest level against the dollar since 1986, trading near 161.9, just below the 162 level markets now view as the intervention line, as the widening US–Japan rate gap overwhelmed repeated verbal warnings and record intervention from Tokyo.
Investment Strategy and Outlook
The earnings engine remains remarkably strong. As the chart shows, S&P 500 12-month-forward EPS has marched steadily higher and now sits at a fresh high of 364.67 — a clean, almost uninterrupted uptrend through the energy shock, the war, and the policy noise. Q1 was exceptional, with index earnings growth tracking near 28% year-over-year, roughly double the consensus at the start of the year, and 84% of companies beating EPS estimates, the highest beat rate since 2021. Fundamentally, corporate America is in good shape.
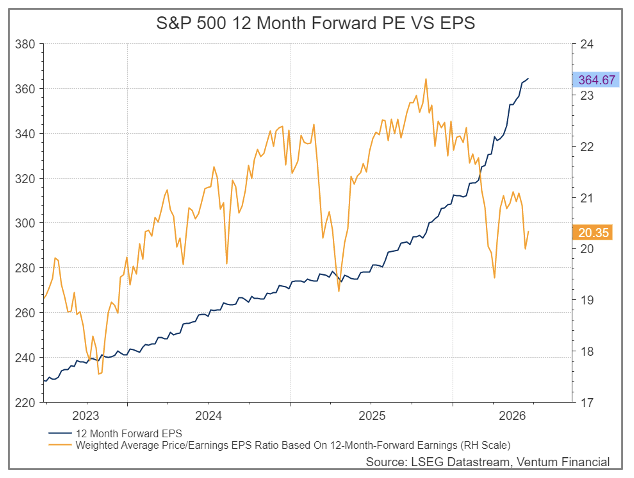
What’s notable is the gap between that fundamental strength and the forward multiple. The weighted-average forward P/E has compressed to roughly 20.4x even as EPS climbs — the price line and the earnings line have diverged. Part of that is the recent tech selloff, but part is investors looking past the strong trailing results to the next set of catalysts, where the picture is murkier. The midterm-election overhang is one plausible driver of the depressed multiple: midterm years have historically been the weakest of the presidential cycle, with an average intra-year drawdown of ~18% and an average price gain of just 3.8% since 1946. Markets tend to discount that uncertainty in advance, which can cap the multiple even while earnings are still rising.
The bigger near-term risk is that the bar is now very high. The recent median surprise rate of ~6.8% positive has set a demanding comparison: with analyst expectations already elevated heading into the coming quarter — consensus is calling for roughly 20%+ full-year S&P 500 EPS growth, and several investment firms have repeatedly raised earnings estimates into what one strategist called an “earnings-led meltup” — it becomes progressively harder to beat. When expectations are this rich, even good results can disappoint, and the miss penalties are unusually severe: margins are near cycle highs, leaving less cushion if growth slows, which raises the odds of sharp rotation and mean-reversion.
This is also where the higher-real-yield theme from our macro sections cuts against equities specifically. Higher real yields are, on balance, a sign of a healthier economy with stronger underlying demand — good for the broad economy. But they are not unambiguously good for this index, because the S&P 500 is now over 50% Tech+ (information technology plus communication services). Those are long-duration, high-multiple sectors whose valuations are the most sensitive to the rising discount rate. The same force that signals economic strength simultaneously pressures the largest slice of the index — a genuine tension at the heart of the current setup.
On positioning, we continue to like Information Technology, Industrials, Consumer Discretionary and Financials over the medium term: IT and Industrials for the durable, AI-driven earnings power that keeps showing up in the numbers, and Financials for the support that a steeper curve and higher-for-longer rates lend to net interest margins. We are growing more positive on US Healthcare as a major benefactor of AI. But in the near term, we think the risk is skewed to the downside for the energy and gold/silver sectors; as oil prices fall from the reopening for the Strait of Hormuz and rising real yields and US dollar pressure precious metal prices.
On a positive note, equity gains were less concentrated in June with the S&P 500 Equal weight index outpacing the cap-weighted index. We note however that the consensus year-end S&P 500 target sits at roughly 7573 (IBES mean), only modestly above current levels, which means much of the good news may already be in the price. If analysts have priced in exuberance — and a ~6.8% surprise rate against already-elevated estimates suggests the easy beats may behind us. In Canada, while we continue to like Canadian banks over the medium term, we caution that their valuations are at record highs.
Han Li . MA CFA
Bert Quattrociocchi, BA CFA
Discretionary Asset Management and Portfolio Strategy
© 2018-2023 Refinitiv. All rights reserved. Republication or redistribution of Refinitiv content, including by framing or similar means, is prohibited without the prior written consent of Refinitiv. Refinitiv and the Refinitiv logo are trademarks of Refinitiv and its affiliated companies.
Ventum Financial Corp. www.ventumfinancial.com
Vancouver Office
2500 – 733 Seymour Street
Vancouver, BC V6B 0S6
Ph: 604-664-2900 | Fax: 604-664-2666
For a complete list of branch offices and contact information, please visit our website.
Participants of all Canadian Marketplaces. Members: Canadian Investment Regulatory Organization, Canadian Investor Protection Fund and AdvantageBC International Business Centre – Vancouver. Estimates and projections contained herein are our own and are based on assumptions which. we believe to be reasonable. Information presented herein, while obtained from sources we believe to be reliable, is not guaranteed either as to accuracy or completeness, nor in providing it does Ventum Financial Corp. assume any responsibility or liability. This information is given as of the date appearing on this report, and Ventum Financial Corp. assumes no obligation to update the information or advise on further developments relating to securities. Ventum Financial Corp. and its affiliates, as well as their respective partners, directors, shareholders, and employees may have a position in the securities mentioned herein and may make purchases and/or sales from time to time. Ventum Financial Corp. may act, or may have acted in the past, as a financial advisor, fiscal agent or underwriter for certain of the companies mentioned herein and may receive, or may have received, a remuneration for their services from those companies. This report is not to be construed as an offer to sell, or the solicitation of an offer to buy, securities and is intended for distribution only in those jurisdictions where Ventum Financial Corp. is registered as an advisor or a dealer in securities. Any distribution or dissemination of this report in any other jurisdiction is strictly prohibited.
For further disclosure information, reader is referred to the disclosure section of our website.