

March has been a tumultuous month for global markets. The closure of the Strait of Hormuz — a once unthinkable scenario — has taken centre stage, sending Brent crude to a high over $115 USD per barrel and triggering a broad retreat across equity markets worldwide.
US equities have borne the brunt of the selloff. As of Friday’s close, all three major indices are deep in the red year-to-date — the S&P 500 down -4.95%, the Dow Jones Industrial Average off -5.17%, and the Nasdaq 100 trailing at -5.35% — with all three breaking below their 200-day moving averages, a technical threshold closely watched as a signal of longer-term trend deterioration. The equal-weight S&P 500 has held up comparatively better, up +0.56% year-to-date and hovering near its 200-day moving average as of Friday’s close — a sign that the damage has been more concentrated in large-cap and technology names than in the broader market.
Canada’s main index, the S&P/TSX, has fared relatively better at -1.25% year-to-date — a reflection, in part, of Canada’s energy export exposure providing a partial offset to the global risk-off tone.
With each passing day, the stakes grow higher. Energy markets remain under acute pressure, and the longer the Strait stays disrupted, the greater the risk that elevated oil prices cease to look transitory. What began as a shock could increasingly feed into longer-term inflation expectations — a scenario that would leave central banks with even less room to maneuver than they already have.
American Economy
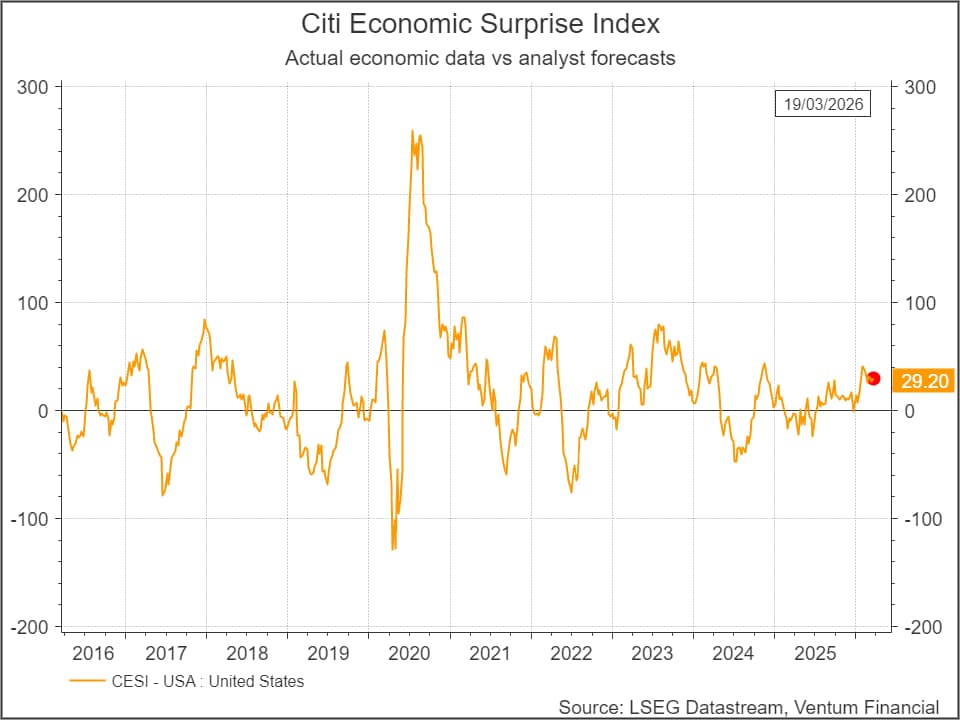
Setting the war aside, the underlying US economic picture appears to be on firmer footing than many expected. Citi’s Economic Surprise Index now sits at 29.2, higher than any reading recorded in 2025, suggesting that incoming data has been consistently beating expectations. That resilience is perhaps most visible in the consumer: retail sales, PCE, and the Redbook measure of same-store sales are each growing at 3.16%, 5.25%, and 6.67% year-over-year respectively, pointing to a household sector that has, so far, held up well.
This backdrop is reflected in the Fed’s latest forecasts. The March Summary of Economic Projections revised 2026 GDP growth up slightly to 2.4% year-over-year — a modest but important upgrade from prior estimates — while the unemployment rate is expected to hold steady at 4.4%, consistent with the latest March reading.
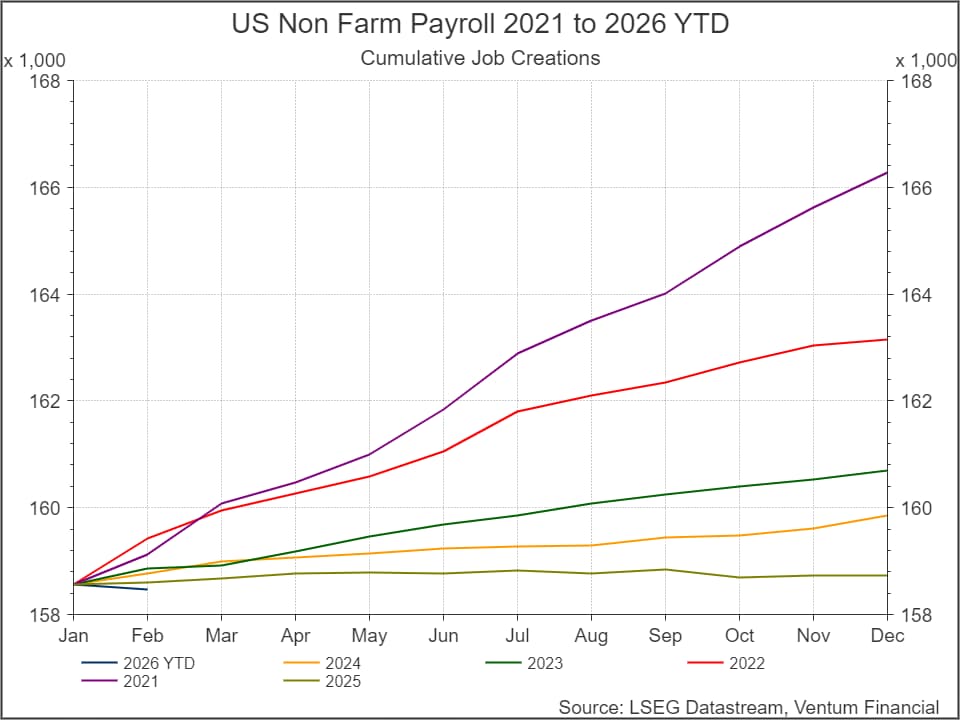
That said, the labour market picture is more nuanced beneath the surface. Non-farm payrolls came in at -92K, a notable softening from last year’s trend. Yet layoffs have remained contained — continuing unemployment claims have hovered around 1.85 million since the start of the year, meaningfully below the 2025 average — suggesting the weakness reflects slower hiring rather than broad-based job losses.
It is against this mixed backdrop that Fed Chair Powell struck a measured tone at the March FOMC meeting. Pushing back on stagflation concerns, he noted that “unemployment is really close to longer-run normal, and inflation is 1 percentage point above that,” reserving the term stagflation for “a much more serious set of circumstances.” The Fed held rates steady, and markets have since recalibrated their expectations: rate cut bets have shifted from two cuts priced in at the start of the year to none over the next twelve months.
For now, the US economy remains in a delicate but stable position. However, we caution that a prolonged conflict in the Middle East could quickly shift that calculus — through higher energy prices, tighter financial conditions, or a deterioration in consumer confidence — risks that are not yet fully reflected in consensus forecasts.
Canadian Economy
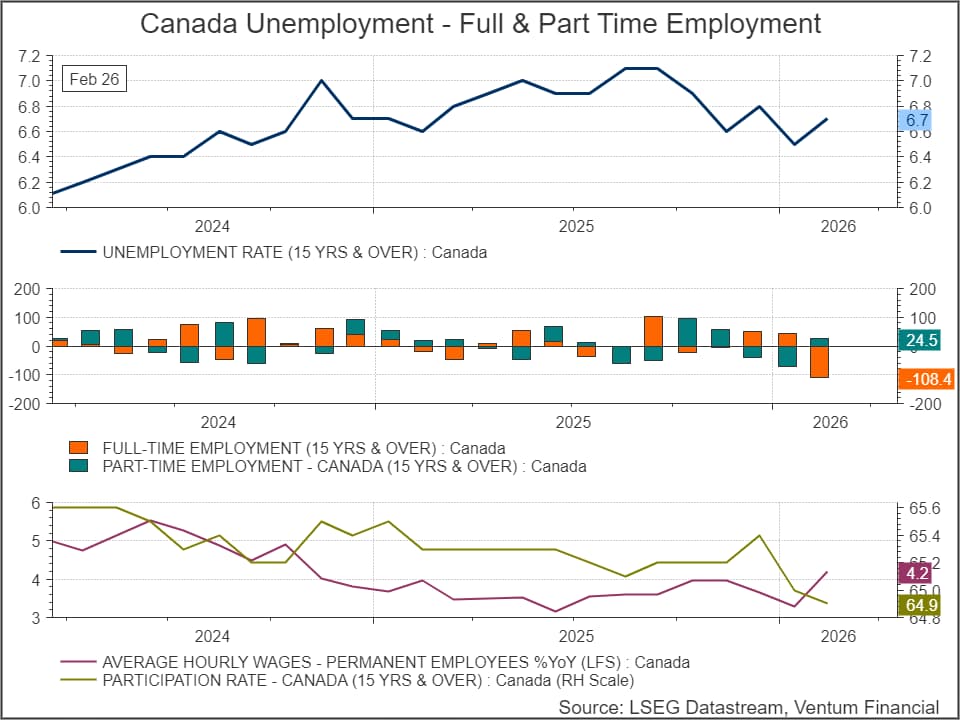
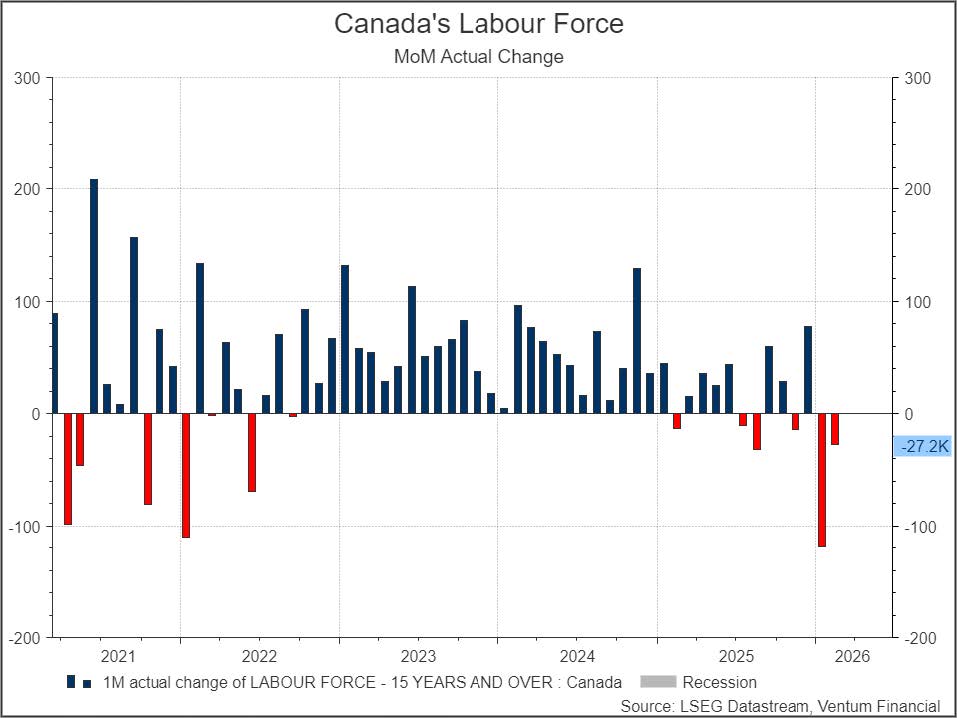
Canada’s labour market has taken a meaningful step back to start the year. Employment fell -24.8K in January and a sharper -83.9K in February, effectively wiping out nearly all of the job gains made in Q4 2025. The unemployment rate edged back up to 6.7% from 6.5% the prior month. Consumption has been equally soft — January retail sales grew just 1.1% month-over-month on the headline, and 0.8% excluding autos, both missing estimates by 0.4%.
We see three possible explanations for this weakness, and they are not mutually exclusive.
The first is straightforward: the Canadian economy remains in a fragile state. Heightened uncertainty around US trade policy is making firms reluctant to hire, and that caution is showing up directly in the jobs data. The second explanation is more transitory — severe weather in January and February likely weighed on both spending and hiring, a pattern that appears in the US data over the same period as well.
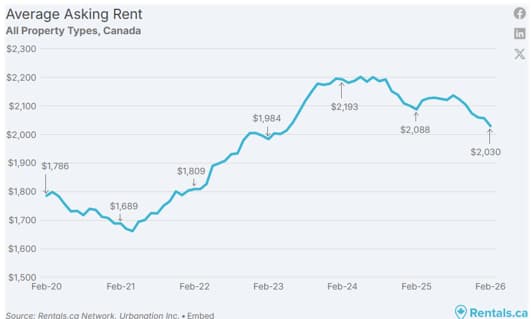
The third explanation is arguably the most structurally significant. Federal policy changes — including caps on international student permits and tighter restrictions on temporary foreign workers — combined with the departure of some existing students and workers, have materially slowed population growth. Canada’s labour force is estimated to have contracted by approximately 150,000 between December and January alone. Rental markets are already reflecting this shift: according to Rentals.ca, the average asking rent has declined from over $2,200 in 2024 to just over $2,000 today. As we have noted previously, falling rental prices will continue to exert disinflationary pressure on the broader economy, while providing a modest tailwind to household purchasing power.
Taken together, this paints a complex picture for Canada’s consumption outlook. At the aggregate level, spending is missing the mark. But the per capita picture looks somewhat brighter. Average hourly wages are now growing at 4.2% year-over-year — the strongest pace of any period in 2025 — suggesting that those who are employed are seeing real income gains. The participation rate, however, has fallen to 64.9%, its lowest level since COVID, complicating the picture further. Notably, the CFIB’s small business survey shows that lack of skilled workers has risen to the second-biggest challenge facing Canadian small businesses, currently above its historical average — a signal that wage pressures may persist even as the broader labour market softens.
On inflation, the picture is more benign. February’s headline CPI came in at 1.8% year-over-year, with core at 2.0% — both well-contained. Even if energy prices push the headline figure higher in the coming months, we believe the broader risk remains to the downside, given the weakness in employment and aggregate demand — though markets are not fully convinced, currently pricing in a 67% chance of a rate hike at the June meeting. Bank of Canada Governor Tiff Macklem captured the dilemma plainly at the March meeting: “Economic weakness combined with rising inflation is a dilemma for central banks. Raising interest rates to slow inflation could further weaken the economy. Easing interest rates to support growth risks pushing inflation well above target.”
There is, however, one meaningful silver lining. As a net energy exporter, Canada stands to benefit from elevated oil prices in a way that most other developed economies do not. Higher energy revenues are flowing back into the country, helping to support the Canadian dollar at a time when many other currencies have come under pressure. As Macklem noted, “relative to some other countries, we are in a pretty good position.”
Sector Performance – S&P 500
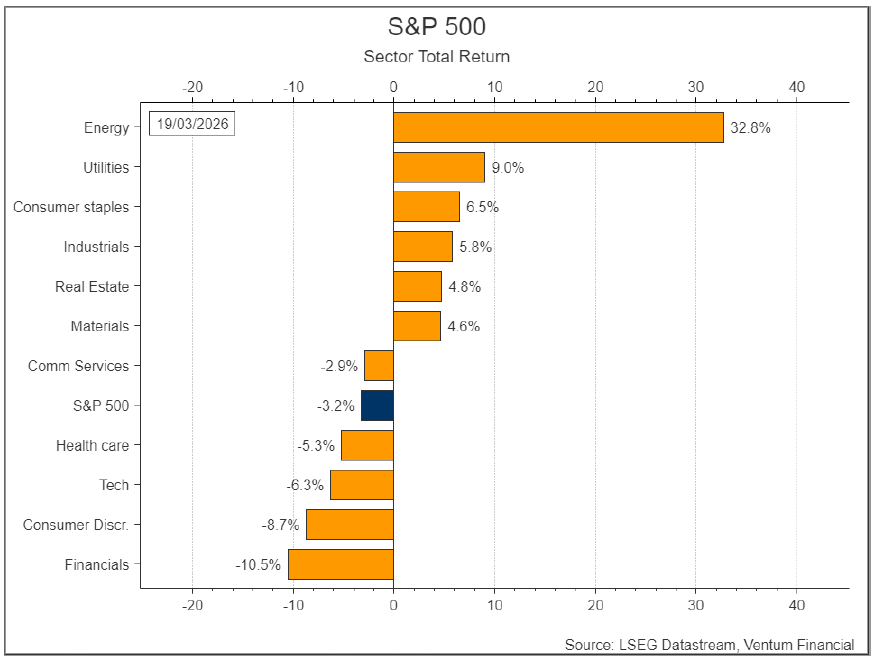
Sector rotation has accelerated in March, with the gap between real-asset and growth-oriented names widening sharply. The S&P 500 is down 3.2% year-to-date, but the headline masks significant dispersion. Energy leads all sectors at +32.8% — nearly double its showing last month — as the Hormuz disruption drives a direct repricing of oil-linked equities. Defensive sectors follow, with Utilities +9.0%, Consumer Staples +6.5%, Industrials +5.8%, Real Estate +4.8%, and Materials +4.6%. On the other side, Financials have fallen -10.5%, Consumer Discretionary -8.7%, Technology -6.3%, and Health Care -5.3%. The rotation that was nascent last month has become the dominant theme — a pronounced flight from rate-sensitive and consumer-cyclical names, with investors unwilling to re-engage until there is greater clarity on both the war and the inflation outlook.
Private credit markets are showing early signs of stress. A growing number of funds have moved to halt or restrict investor redemptions, reflecting mounting concern over exposure to software and technology-dependent borrowers whose business models face obsolescence risk in an AI-driven landscape. Both the VanEck BDC Income ETF (BIZD) and the Virtus Private Credit Strategy ETF (VPC) have declined sharply in recent months, with BIZD now trading near multi-year lows. We are closely watching developments in this space. With the US private credit market approaching $2 trillion in total value, a broader deterioration in credit quality could have meaningful knock-on effects for the wider economy.

Sector Performance – S&P/TSX
The S&P/TSX tells a similar story, though Canada’s energy export advantage has helped the index hold up better than its US counterparts — up 0.9% year-to-date. Energy leads decisively at +27.7%, with Utilities +9.9% and Telecom +6.3% rounding out the outperformers. Consumer Staples and Materials are clinging to marginal gains at +0.5% and +0.2% respectively — the latter having surrendered most of its earlier advance, as gold-heavy constituents gave back gains in the face of higher interest rates and a firmer US dollar, leaving the index roughly flat on the year.
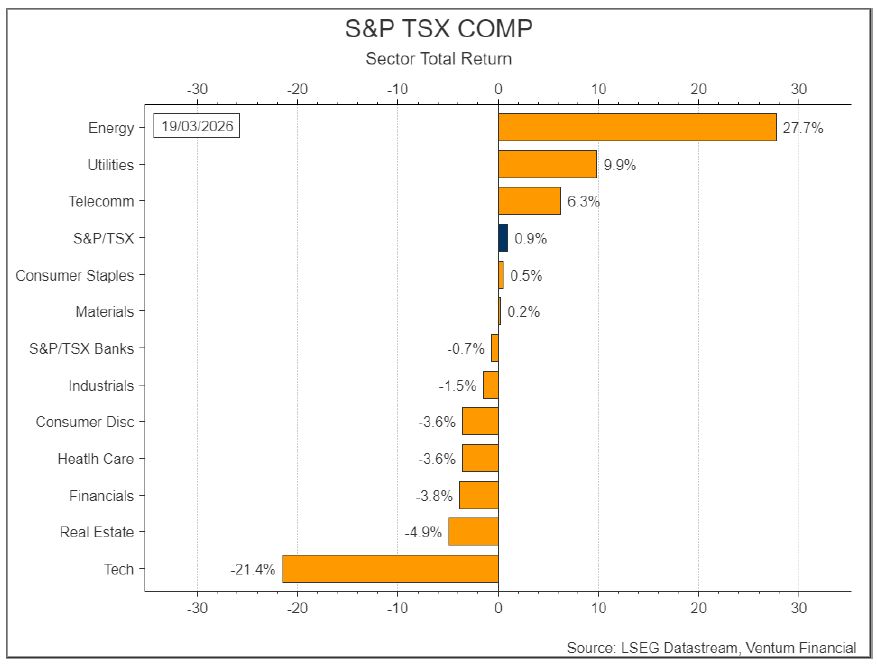
On the downside, Real Estate has declined -4.9%, Financials -3.8%, Consumer Discretionary and Health Care both -3.6%, and Industrials -1.5%. The standout laggard, however, is Technology at -21.4% — a stark reminder that Canada is not insulated from the global repricing of growth and software-exposed names, and one that ties directly into the private credit concerns outlined above.
Investment Strategy and Outlook
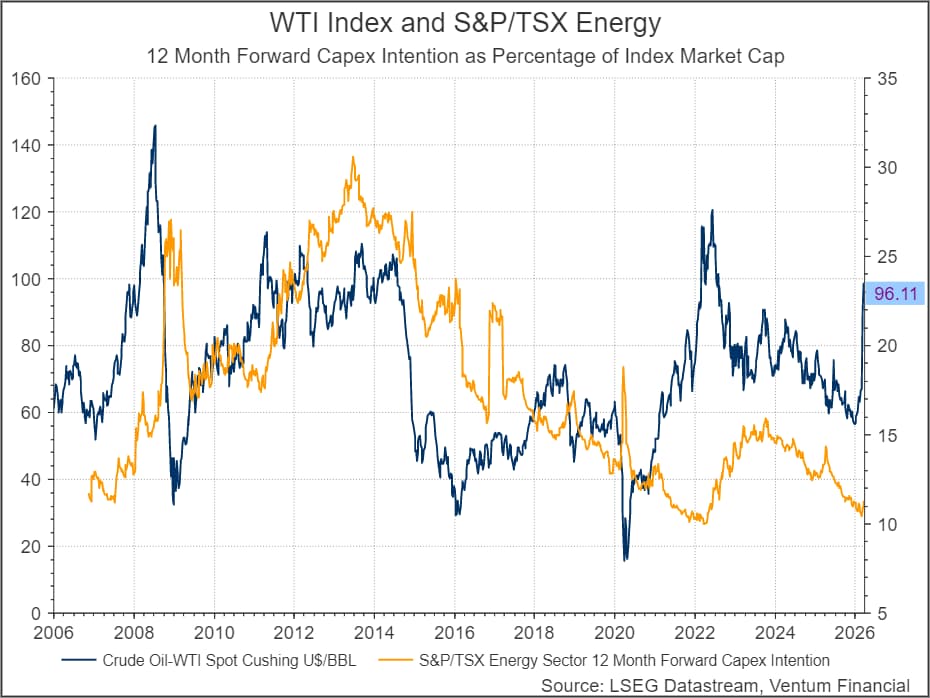
Though uncertainties around USMCA negotiations persist, the current energy market environment potentially provides Canada with significant leverage. The US imports roughly 4 million barrels of crude per day from Canada — a volume that is difficult to replace in an environment where Brent is hovering near $100 USD per barrel. Beyond the immediate windfall in oil revenues, Canadian energy capex could rise meaningfully; unlike energy investments in the Middle East, Canadian supply does not carry the same geopolitical risk premium, making it an attractive destination for long-term capital even in a post-ceasefire environment. That said, the data tells a more nuanced story — S&P/TSX energy sector capex intentions as a share of market cap have declined to near multi-year lows, suggesting that while producers are benefiting from higher valuations, incremental capital deployment has not kept pace with the rally. Whether this reflects producer discipline, uncertainty around trade policy, or skepticism that today’s price levels are sustainable beyond the immediate geopolitical shock remains to be seen — but it suggests the current energy boom may remain a revenue windfall rather than a broader investment cycle, at least for now.
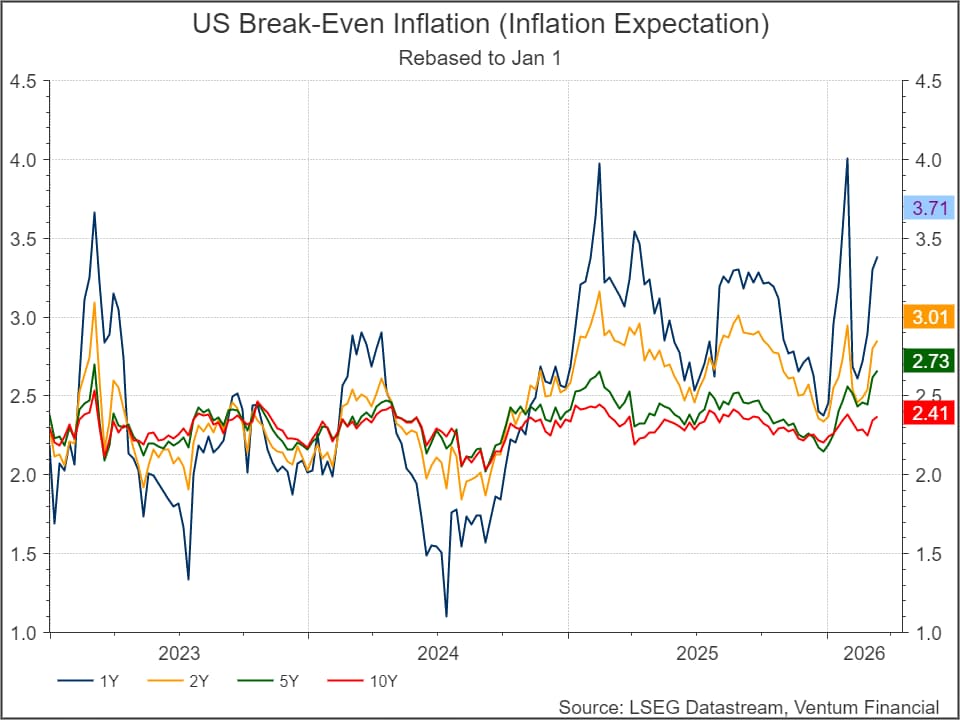
The biggest risk to this year’s outlook remains higher inflation and higher yields. With each passing day of the conflict, energy markets face greater stress, reigniting inflation fears across global markets. In the United States, break-even inflation rates — the market’s forward-looking gauge of price expectations — have surged to near three-year highs. The 1-year break-even has spiked to 3.71% and the 2-year has climbed to 3.01%, levels not seen since the post-pandemic inflation wave of 2022–2023. Even longer-duration measures have moved materially, with the 5-year at 2.73% and the 10-year at 2.41%, signaling that markets are pricing in a more persistent inflation threat rather than a transitory shock.
Across the yield curve, US 2-year and 10-year Treasury yields now sit at 3.90% and 4.39% respectively, while Canadian equivalents have also risen sharply to 3.07% and 3.56% — reflecting a synchronized global repricing of rate risk.

The ripple effects are being felt across G10 central banks, many of which had only recently begun easing policy after a prolonged tightening cycle. Several are now being forced to reverse course. The Reserve Bank of Australia raised its policy rate for a second consecutive month to 4.1%, explicitly warning of a “material” risk to the inflation outlook stemming from the conflict. Australia’s reversal is the starkest example of a broader dilemma: central banks in Norway, Canada, the UK, and the Euro zone — all of which had been steadily cutting rates through late 2025 — now face the prospect of re-tightening into a supply-driven price shock, a scenario that risks choking off already fragile economic growth.
We anticipate continued, elevated volatility and uncertainty across global markets, as the US/Israel/Iran regional conflict and the closure of the Strait of Hormuz — which accounts for 20% of the world’s oil transit — to remain at the forefront of investor concerns. As of this report, US President Trump has announced a five-day postponement of strikes on Iranian infrastructure, citing ‘productive’ talks with Iranian officials. However, skepticism persists among both Iranian and Arab leaders regarding the progress and sincerity of these negotiations. This announcement has triggered a rapid surge in equity markets, a sharp drop in oil prices, and lower interest rates, reflecting the market’s sensitivity to any hint of de-escalation. While today’s developments offer a glimmer of optimism and the possibility of the Strait reopening, it is far too early to determine when or if the conflict will meaningfully abate. The situation remains highly fluid, and we continue to monitor events closely as they unfold.
© 2018-2023 Refinitiv. All rights reserved. Republication or redistribution of Refinitiv content, including by framing or similar means, is prohibited without the prior written consent of Refinitiv. Refinitiv and the Refinitiv logo are trademarks of Refinitiv and its affiliated companies.
Ventum Financial Corp. www.ventumfinancial.com
Vancouver Office
2500 – 733 Seymour Street
Vancouver, BC V6B 0S6
Ph: 604-664-2900 | Fax: 604-664-2666
For a complete list of branch offices and contact information, please visit our website.
Participants of all Canadian Marketplaces. Members: Canadian Investment Regulatory Organization, Canadian Investor Protection Fund and AdvantageBC International Business Centre – Vancouver. Estimates and projections contained herein are our own and are based on assumptions which. we believe to be reasonable. Information presented herein, while obtained from sources we believe to be reliable, is not guaranteed either as to accuracy or completeness, nor in providing it does Ventum Financial Corp. assume any responsibility or liability. This information is given as of the date appearing on this report, and Ventum Financial Corp. assumes no obligation to update the information or advise on further developments relating to securities. Ventum Financial Corp. and its affiliates, as well as their respective partners, directors, shareholders, and employees may have a position in the securities mentioned herein and may make purchases and/or sales from time to time. Ventum Financial Corp. may act, or may have acted in the past, as a financial advisor, fiscal agent or underwriter for certain of the companies mentioned herein and may receive, or may have received, a remuneration for their services from those companies. This report is not to be construed as an offer to sell, or the solicitation of an offer to buy, securities and is intended for distribution only in those jurisdictions where Ventum Financial Corp. is registered as an advisor or a dealer in securities. Any distribution or dissemination of this report in any other jurisdiction is strictly prohibited.
For further disclosure information, reader is referred to the disclosure section of our website.