

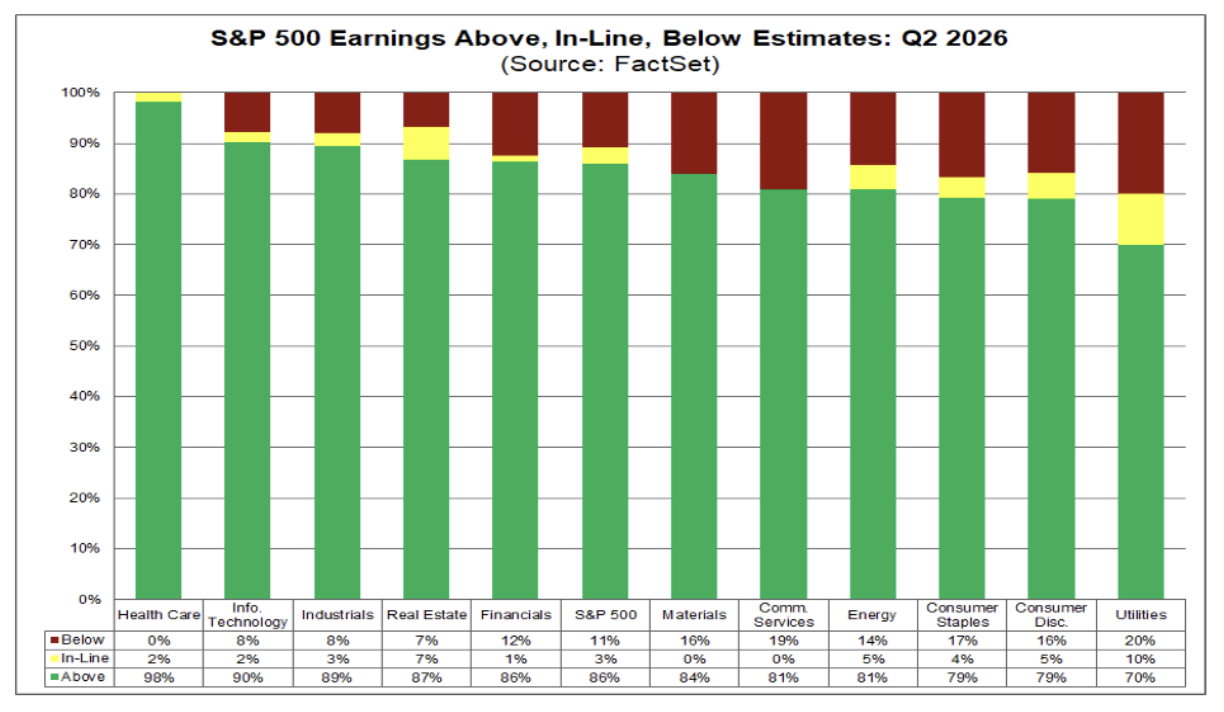
As of earnings reported through August 7th, 88% of the S&P 500 has reported second quarter results. Surprises have been strong: 86% of companies beat EPS estimates, the highest positive surprise rate since Q2 2021, and well above the 5-year (78%) and 10-year (76%) averages. On revenue, 76% topped estimates, also above both historical averages. In aggregate, earnings are coming in 29.2% above estimates — a record since FactSet began tracking the metric in 2008 — though this figure is heavily distorted by outsized surprises from Alphabet and Amazon, both boosted by large gains on equity investments (including stakes in SpaceX and Anthropic, respectively). Excluding those two names, the aggregate surprise falls to a still-healthy 10.9%. Net, this is a broad-based, historically strong beat season, not one manufactured by a handful of outliers.
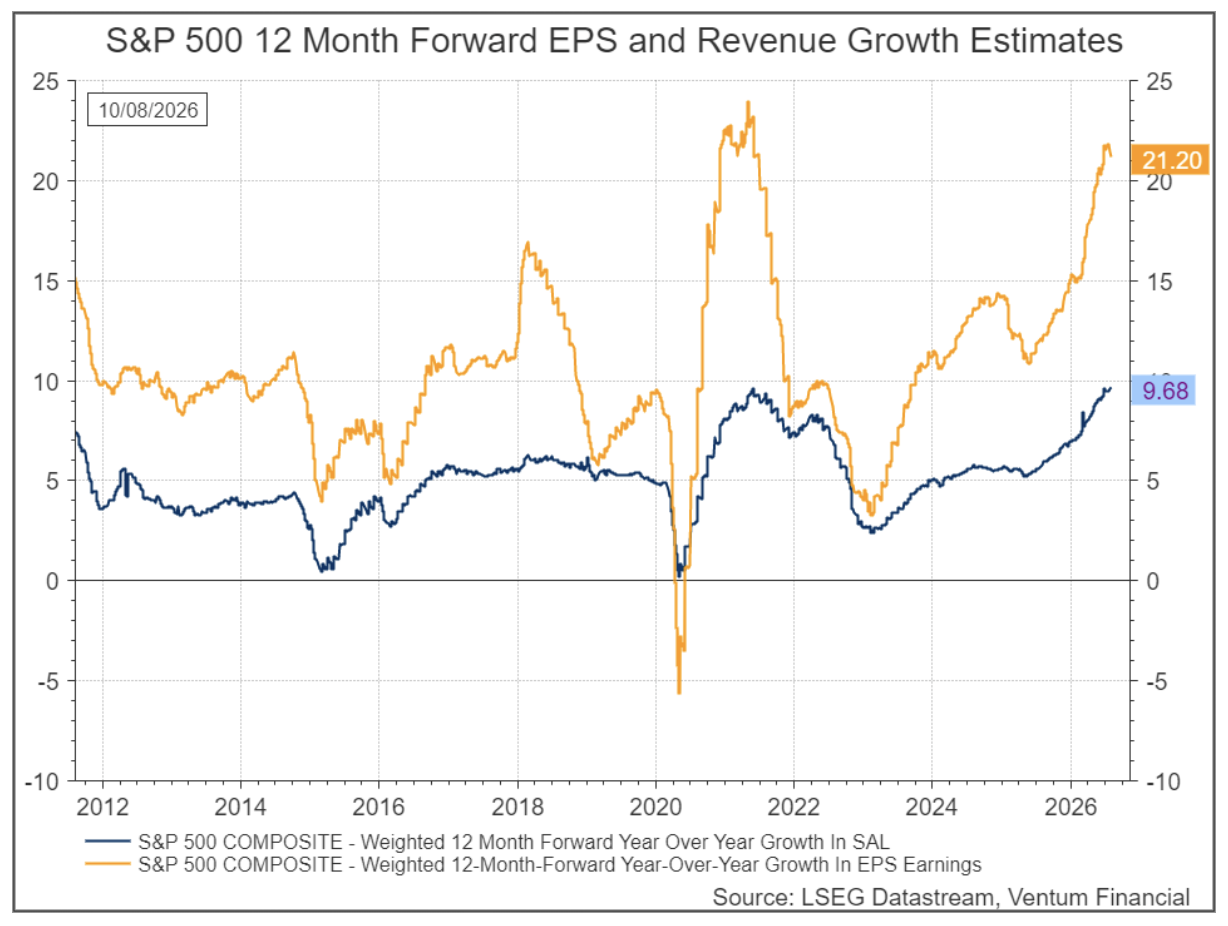
Forward-looking estimates echo the strength in trailing results. The 12-month forward revenue growth estimate for the S&P 500 has climbed to 9.68%, matching the highs last seen in the 2021 post-pandemic recovery. Forward EPS growth estimates, at 21.20%, remain just below the 2021 peak of roughly 23-24% but are running at their highest level in several years, well above the 2022-2024 range. Analysts are not merely rationalizing a strong reporting season — they are extrapolating it forward.
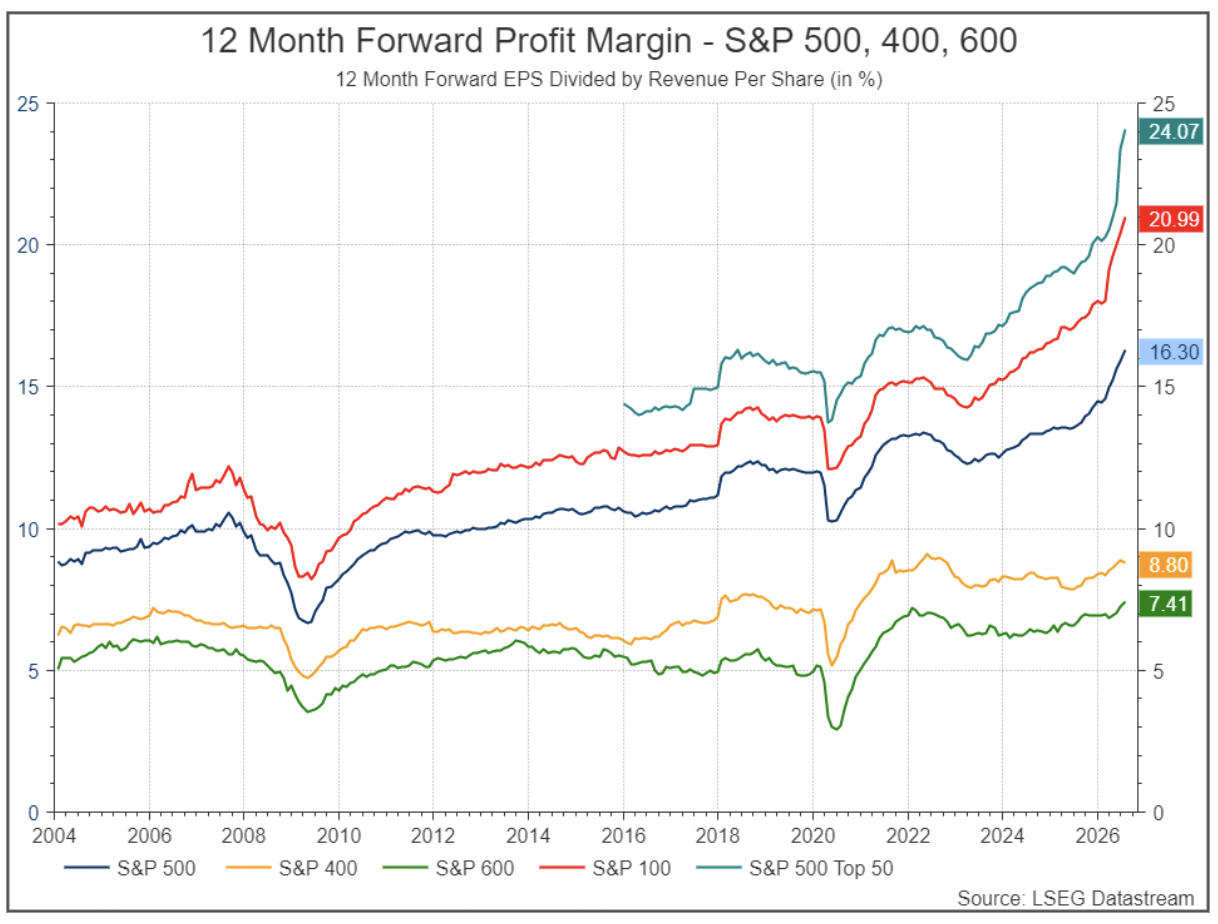
Forward margin expansion tells a similar story of concentration. The 12-month forward profit margin for the S&P 500 Top 50 has climbed to 24.07%, and the S&P 100 to 20.99% — both breaking sharply higher and far above anything in the post-2004 history. The broader S&P 500 sits at 16.30%, also a record, but that headline figure is being pulled up disproportionately by the largest names. Mid-cap (S&P 400) and small-cap (S&P 600) forward margins, by contrast, are at 8.80% and 7.41% respectively — elevated relative to their own history, but tracking a far more modest, steadier trajectory with none of the acceleration seen at the top of the market. The margin story of this cycle isn’t broad-based profitability improvement; it’s the largest 50-100 companies pulling away from the rest of the index.
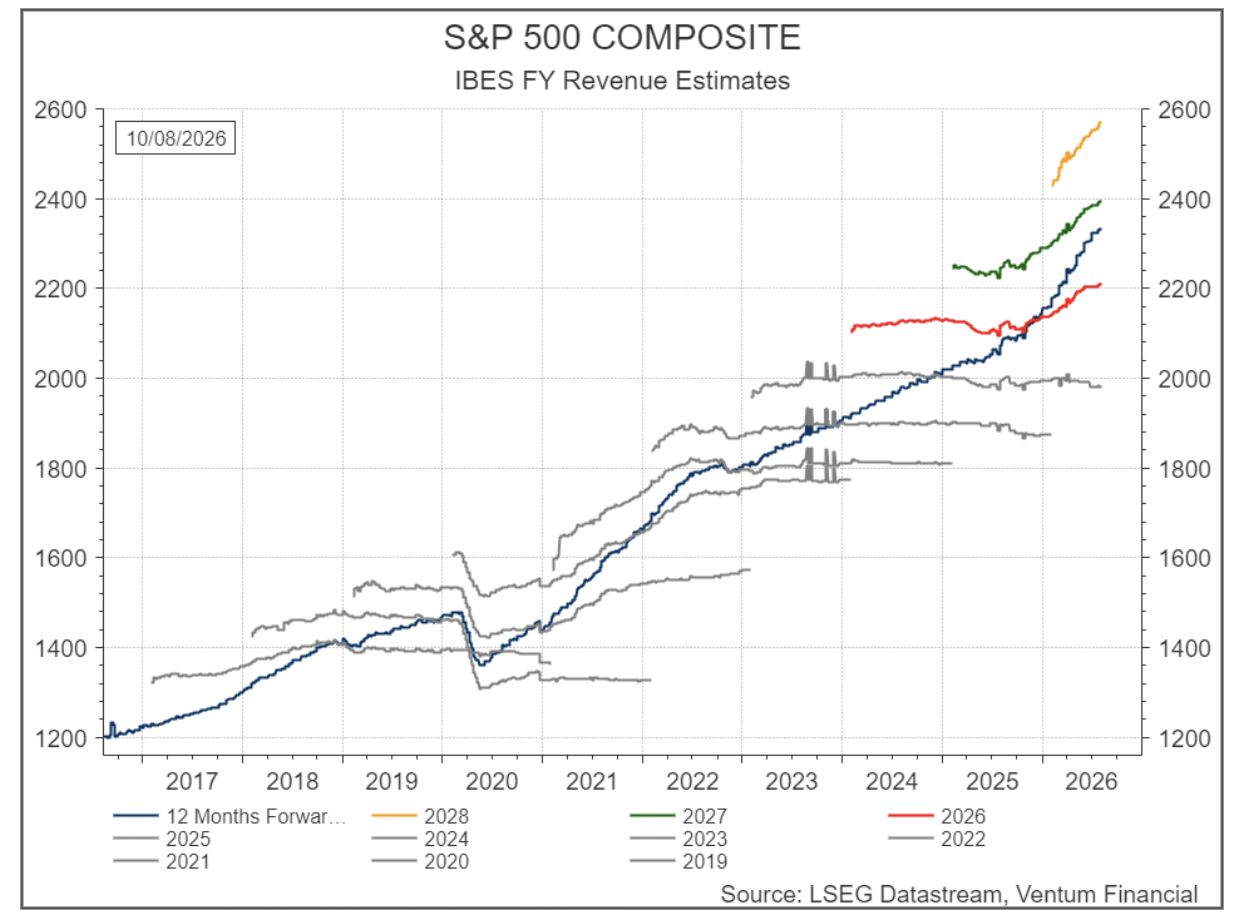
Revision trends by estimate-year vintage confirm the pattern. Both the 2023 and 2024 EPS and revenue estimate lines trended steadily lower over their respective periods, consistent with the drag from rising rates during that stretch. The 2025 estimate line, by contrast, was essentially flat for most of the year — earnings and revenue expectations for 2025 held roughly steady around $260-265 in EPS and $1,980-2,000 in revenue, reflecting the uncertainty around the new administration and tariff policy rather than outright deterioration.
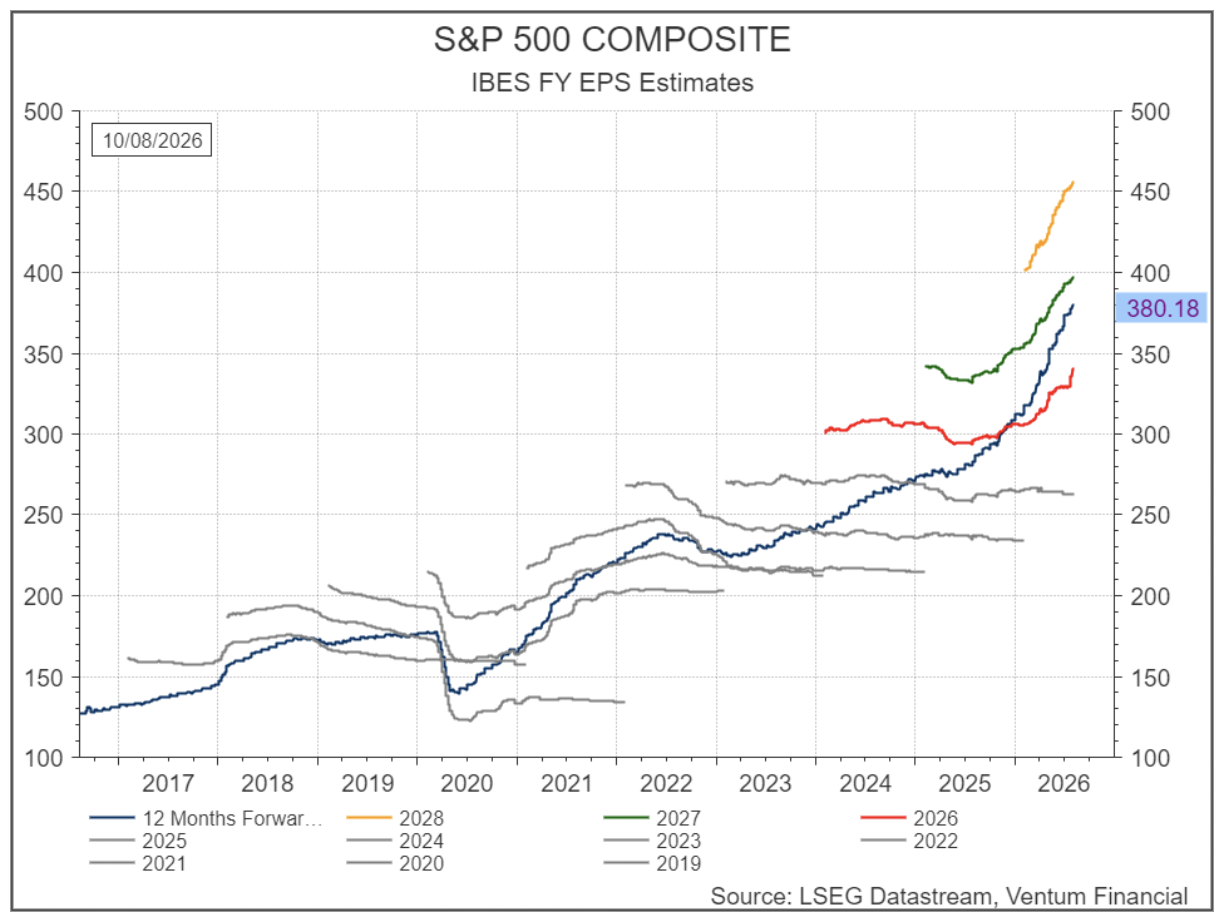
The 2026, 2027, and 2028 vintages tell a very different story. All three are being revised sharply higher in real time: 2026 EPS estimates have climbed from roughly $300 to $340, 2027 from about $335 to $398, and 2028 from $400 to $455 — a steep, sustained upward trajectory rather than the gradual grind seen in prior years. The revenue estimate chart mirrors this exactly, with 2026-2028 revenue estimates all trending firmly higher over the same window. Analysts aren’t just holding estimates steady in the face of strong results — they are actively raising forward-year numbers, and the magnitude and persistence of these upward revisions across three separate fiscal-year vintages is a meaningfully different signal than anything seen since before the 2022 rate-hiking cycle began.
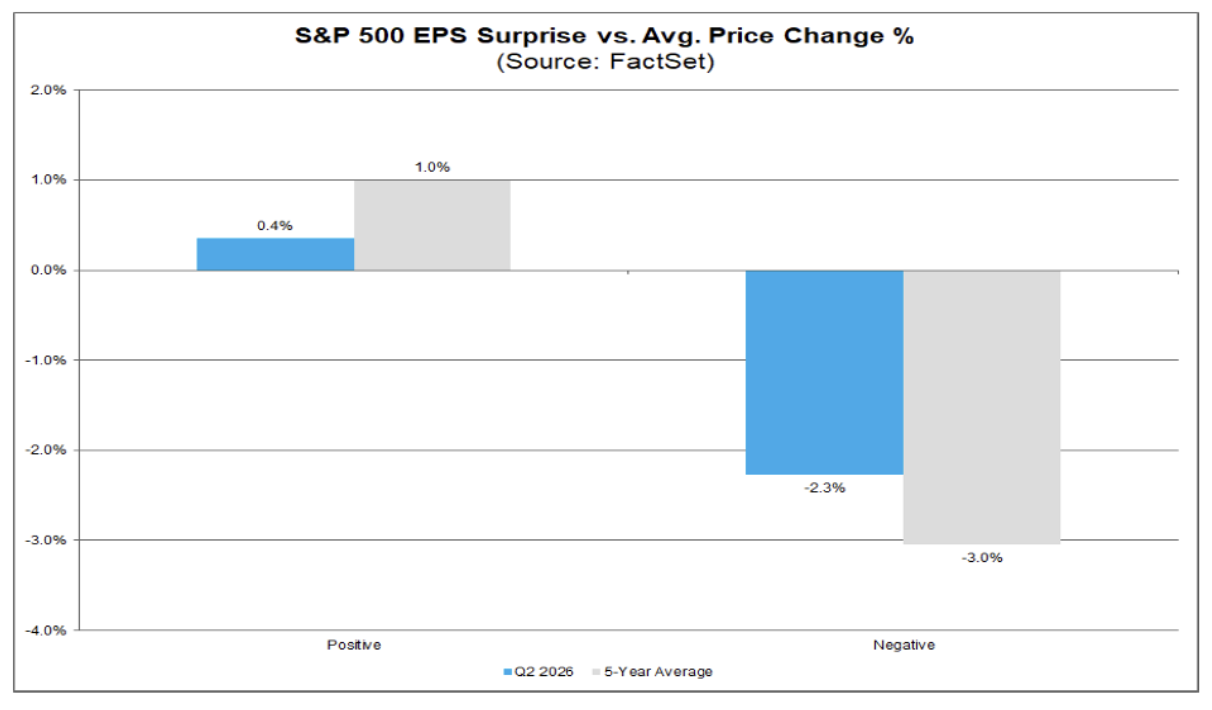
Despite the historically strong beat rate, price reactions to positive surprises this quarter have been muted. Companies with positive EPS surprises saw an average price move of just 0.4% (two days before through two days after reporting), well below the 5-year average of 1.0%. The reward for beating estimates has simply been smaller than usual. On the flip side, misses have been less punishing: companies with negative surprises saw an average price decline of 2.3%, compared to the 5-year average of 3.0%.
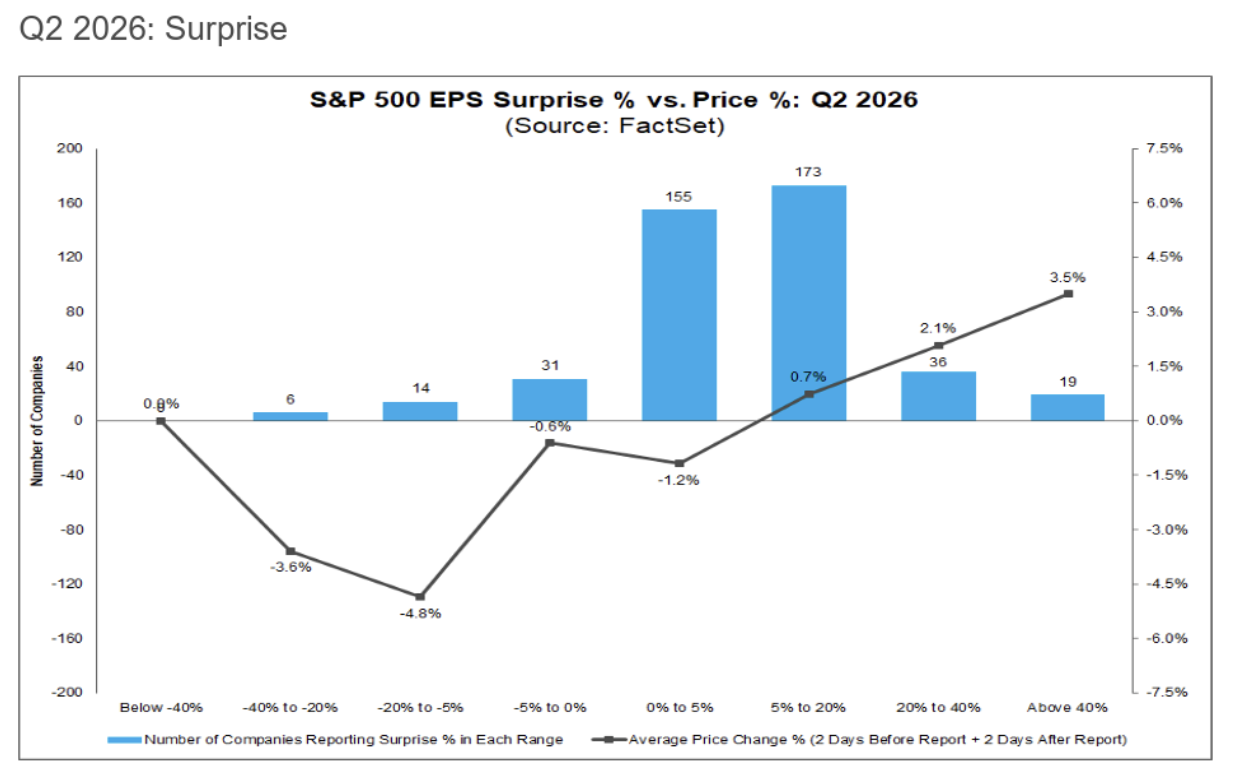
Breaking down the distribution further, the reaction is skewed almost entirely toward outsized beats. The 155 companies that beat by a modest 0-5% actually saw prices decline on average by 1.2% — a “sell the beat” reaction, effectively treating an in-line-to-small beat as disappointing. It was only the 173 companies beating by 5-20% that saw a positive reaction, up 0.7% on average, while the smaller group beating by 20-40% (36 companies) and above 40% (19 companies) saw the strongest gains, at 2.1% and 3.5% respectively. Combined, this suggests the market had already priced in a strong season and is reserving genuine enthusiasm for large surprises, while treating modest beats with indifference or outright disappointment — even as it shows more tolerance than usual for companies that miss outright.
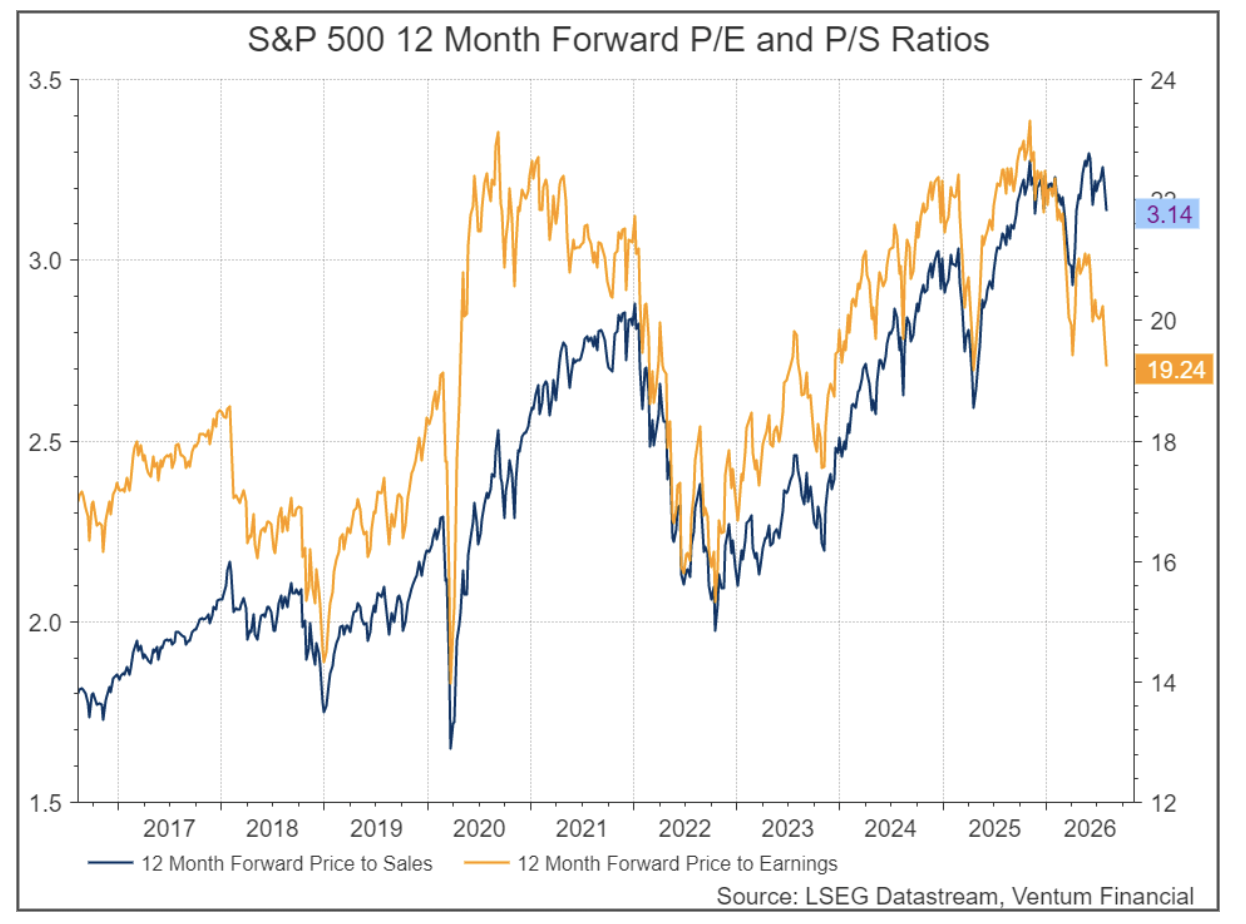
From a valuation standpoint, the divergence between the two multiples is notable. The forward P/E has fallen back to 19.24, well off the 2025 peak near 23, and now sits close to where it was for much of 2023-2024. Forward price-to-sales, however, remains at 3.14 — not far below its own 2025 high of roughly 3.25-3.3, and still well above any level seen prior to 2024. In other words, the pullback in the earnings multiple has been driven largely by the margin expansion and EPS growth already discussed, rather than by the market becoming genuinely cheaper. On a sales basis, the S&P 500 remains near its most expensive levels on record, which suggests investors are still paying a full price for each dollar of revenue even as the earnings multiple has moderated. This is consistent with a market that is pricing in continued margin expansion rather than one that has become more conservative.
Sector-level data confirms this isn’t just an index-wide phenomenon. On a forward price-to-sales basis, most sectors are trading well above their 10-year average and in the upper portion of their historical range. Info Tech, at roughly 7.3x, sits in the top third of its 3.3x-9.0x decade range and well above its average. Communication Services (~3.8x within a 1.3x-4.5x range), Industrials (~2.7x within 1.2x-3.0x), Financials (~2.9x within 1.5x-3.5x), and Utilities (~2.5x within 1.7x-3.1x) all show the same pattern — current multiples sitting comfortably above their long-run averages and closer to their historical highs than their lows.
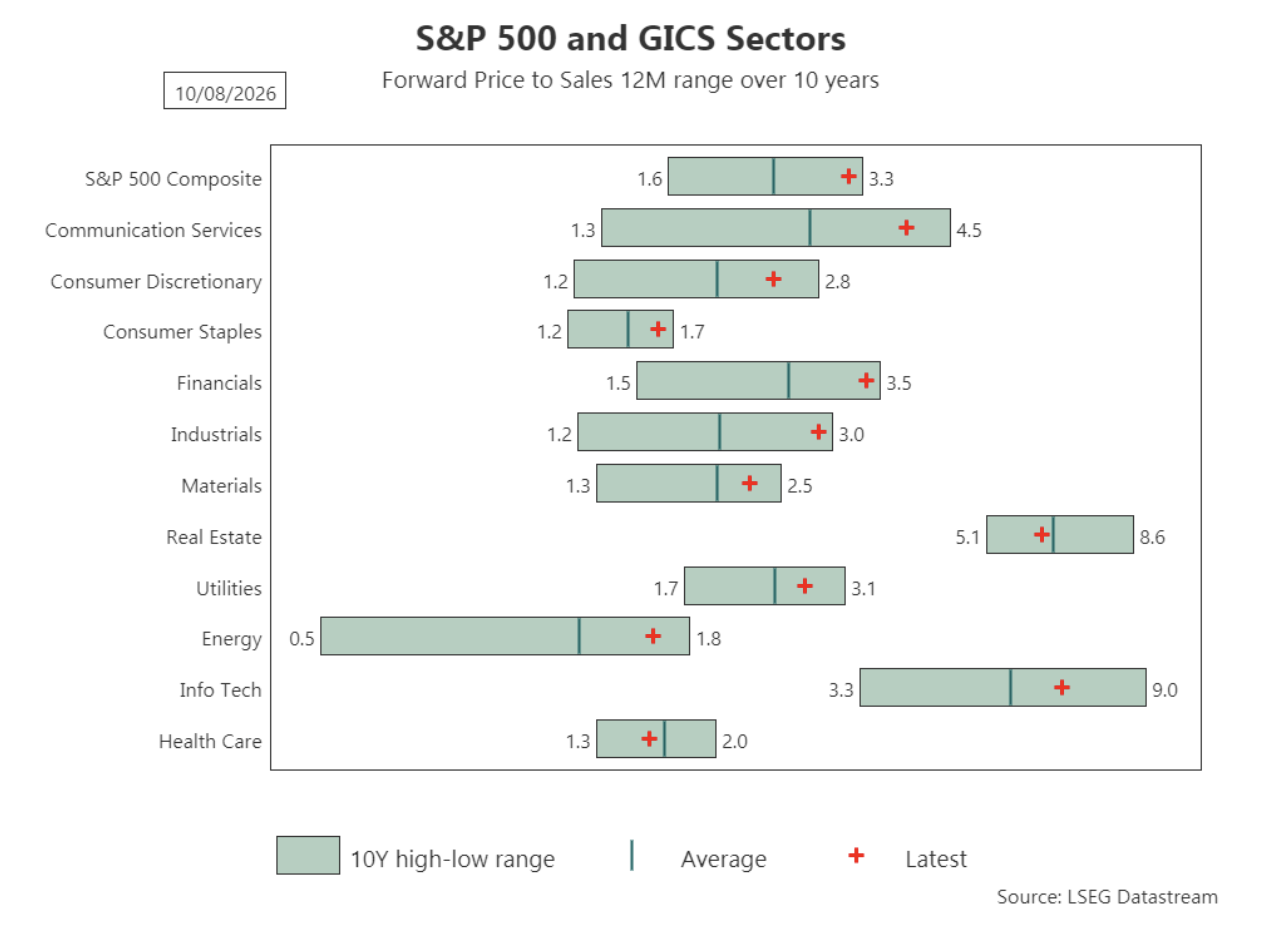
The two clear exceptions are Health Care, trading at roughly 1.5x within a 1.3x-2.0x range — below its 10-year average, consistent with the sector’s earnings decline noted earlier — and Real Estate, at roughly 6.3x within a wide 5.1x-8.6x range, sitting closer to the middle of its historical band. Outside of those two, the message from the sector breakdown is consistent with the index-level picture: on a sales basis, the market is broadly expensive across cyclicals, defensives, and growth sectors alike, not just concentrated in the mega-cap technology names driving the earnings and margin story.
The central theme running through this earnings season is that S&P 500 growth remains genuinely strong — record margins, accelerating forward estimates across 2026-2028, and a guidance backdrop that is overwhelmingly positive in key sectors like Info Technology. The challenge for investors is that a meaningful amount of this strength already appears to be priced in, particularly on a price-to-sales basis, where the index and most sectors are trading near the top of their 10-year ranges. The muted reaction to modest earnings beats — and in some cases outright “sell the beat” behavior — is a sign that the market has grown accustomed to good news and is no longer rewarding it by default. From here, further upward revisions are likely needed to justify additional index gains; growth that merely meets already-elevated expectations may not be enough. At the same time, the asymmetry cuts both ways — while misses have so far been punished less than average, that tolerance should not be taken for granted. In a market pricing in continued strength, a genuine disappointment or a stall in the revision trend is the more likely catalyst for a sharper correction than the strong headline numbers would suggest.
Han Li . MA CFA
Bert Quattrociocchi, BA CFA
Discretionary Asset Management and Portfolio Strategy
© 2018-2023 Refinitiv. All rights reserved. Republication or redistribution of Refinitiv content, including by framing or similar means, is prohibited without the prior written consent of Refinitiv. Refinitiv and the Refinitiv logo are trademarks of Refinitiv and its affiliated companies.
Ventum Financial Corp. www.ventumfinancial.com
Vancouver Office
2500 – 733 Seymour Street
Vancouver, BC V6B 0S6
Ph: 604-664-2900 | Fax: 604-664-2666
For a complete list of branch offices and contact information, please visit our website.
Participants of all Canadian Marketplaces. Members: Canadian Investment Regulatory Organization, Canadian Investor Protection Fund and AdvantageBC International Business Centre – Vancouver. Estimates and projections contained herein are our own and are based on assumptions which. we believe to be reasonable. Information presented herein, while obtained from sources we believe to be reliable, is not guaranteed either as to accuracy or completeness, nor in providing it does Ventum Financial Corp. assume any responsibility or liability. This information is given as of the date appearing on this report, and Ventum Financial Corp. assumes no obligation to update the information or advise on further developments relating to securities. Ventum Financial Corp. and its affiliates, as well as their respective partners, directors, shareholders, and employees may have a position in the securities mentioned herein and may make purchases and/or sales from time to time. Ventum Financial Corp. may act, or may have acted in the past, as a financial advisor, fiscal agent or underwriter for certain of the companies mentioned herein and may receive, or may have received, a remuneration for their services from those companies. This report is not to be construed as an offer to sell, or the solicitation of an offer to buy, securities and is intended for distribution only in those jurisdictions where Ventum Financial Corp. is registered as an advisor or a dealer in securities. Any distribution or dissemination of this report in any other jurisdiction is strictly prohibited.
For further disclosure information, reader is referred to the disclosure section of our website.