

Key Takeaways
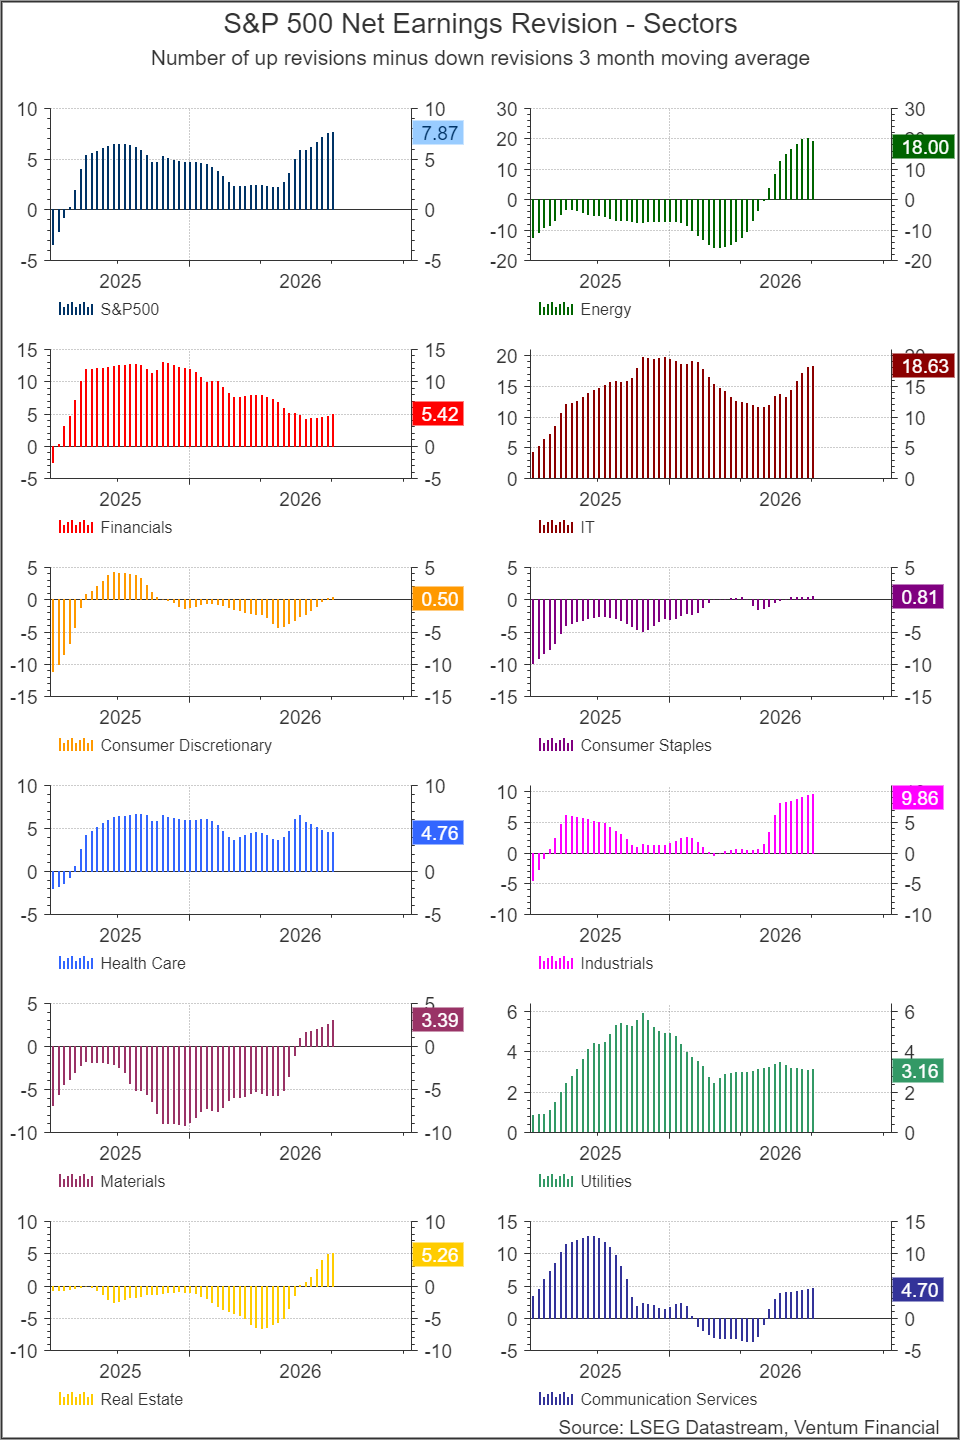
- Ahead of Q3 earnings season, net earnings revisions (up revisions minus down revisions, 3-month moving average) are positive across all 11 S&P 500 sectors — a breadth of upward revisions that has rarely occurred since 2021.
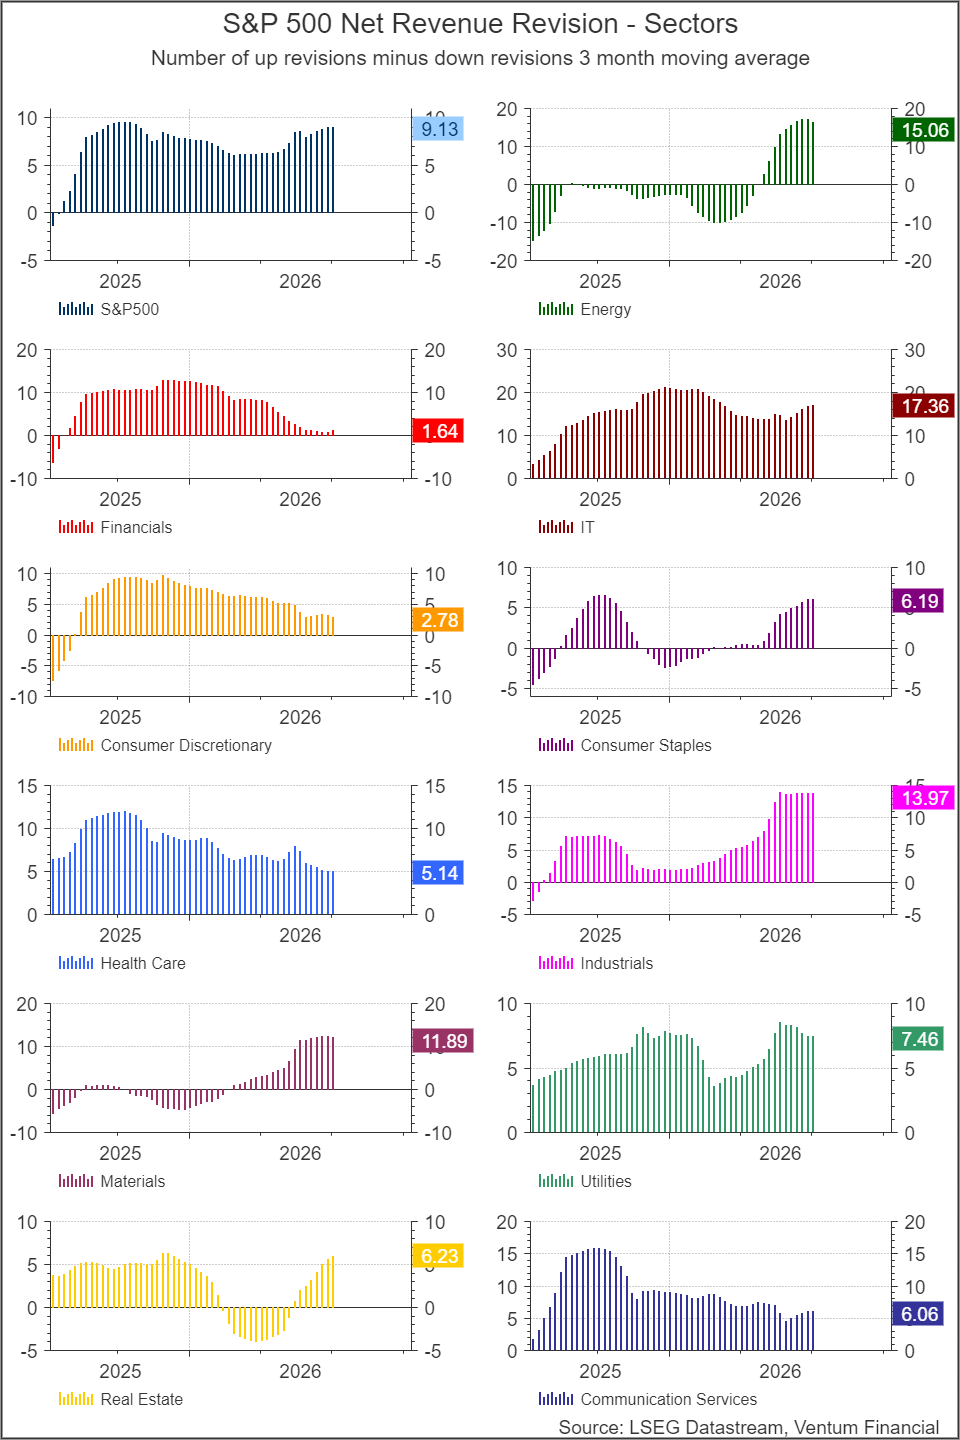
- Net revenue revisions confirm the earnings picture: all 11 sectors are also positive on the revenue revision measure, suggesting the earnings improvement is being driven by genuine top-line strength rather than cost-cutting or margin engineering alone.
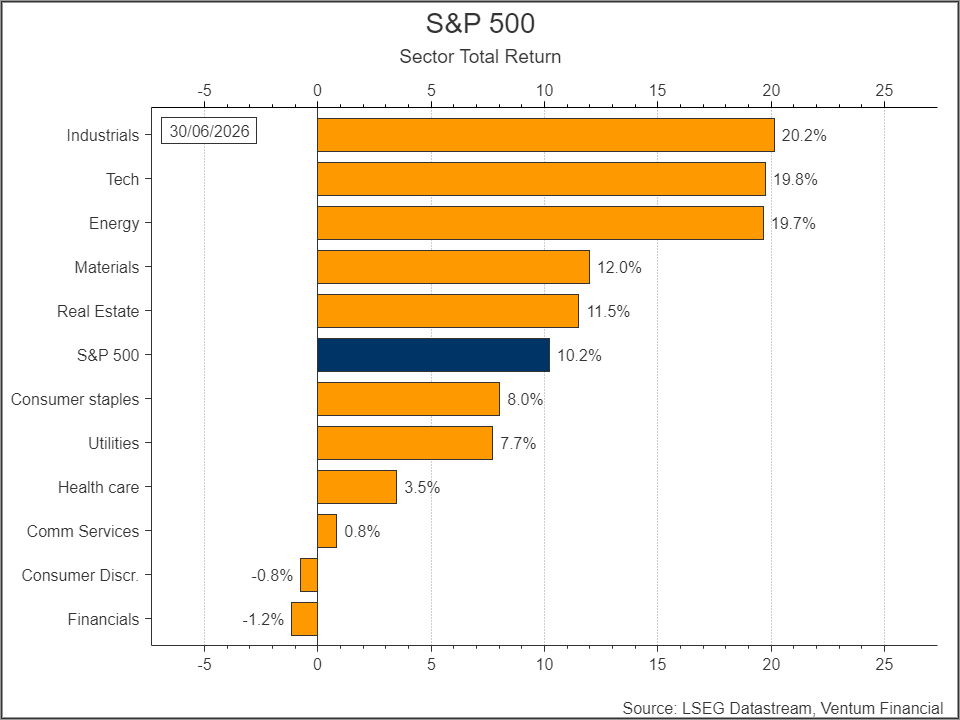
- S&P 500 Financials, despite still-positive revisions, has lost momentum into Q3 and is the weakest performer over the last six months (-1.2% total return), followed by Consumer Discretionary (-0.8%).
- The escalating US-Iran conflict is a two-edged sword: it is lifting oil prices and Energy-sector performance (+19.7% six-month return) while pushing up interest-rate expectations and squeezing consumer wallets — a headwind visible in Consumer Discretionary’s return underperformance.
- Canada is more mixed than the U.S.: S&P/TSX aggregate earnings revisions are a modest 1.85, with Real Estate (-13.4) leading four sectors still negative, while Financials, Health Care and Energy lead the upgrade cycle.
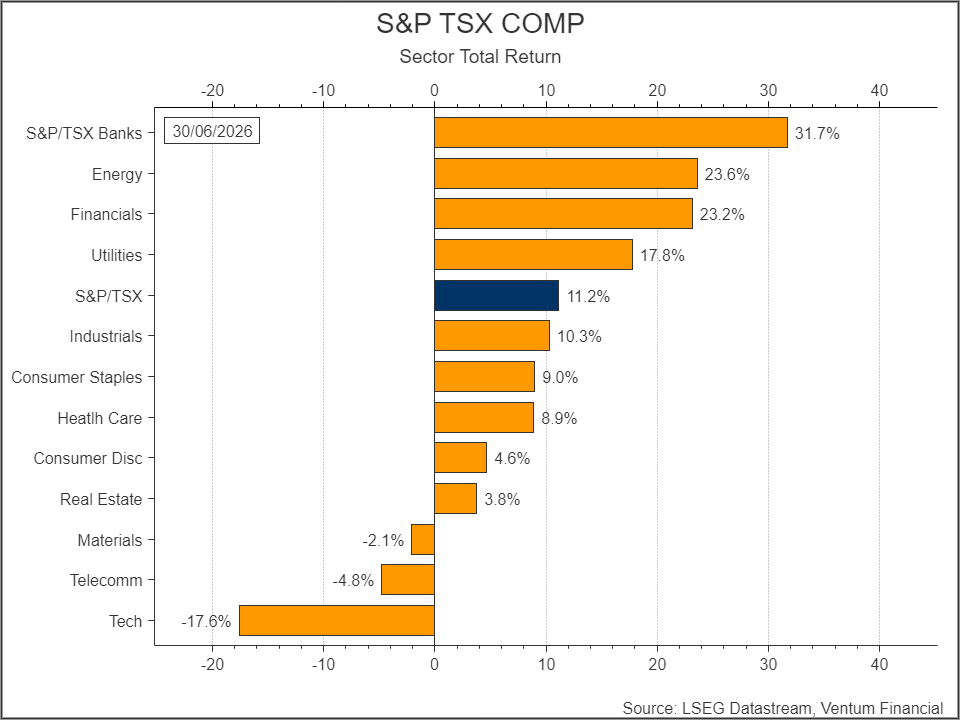
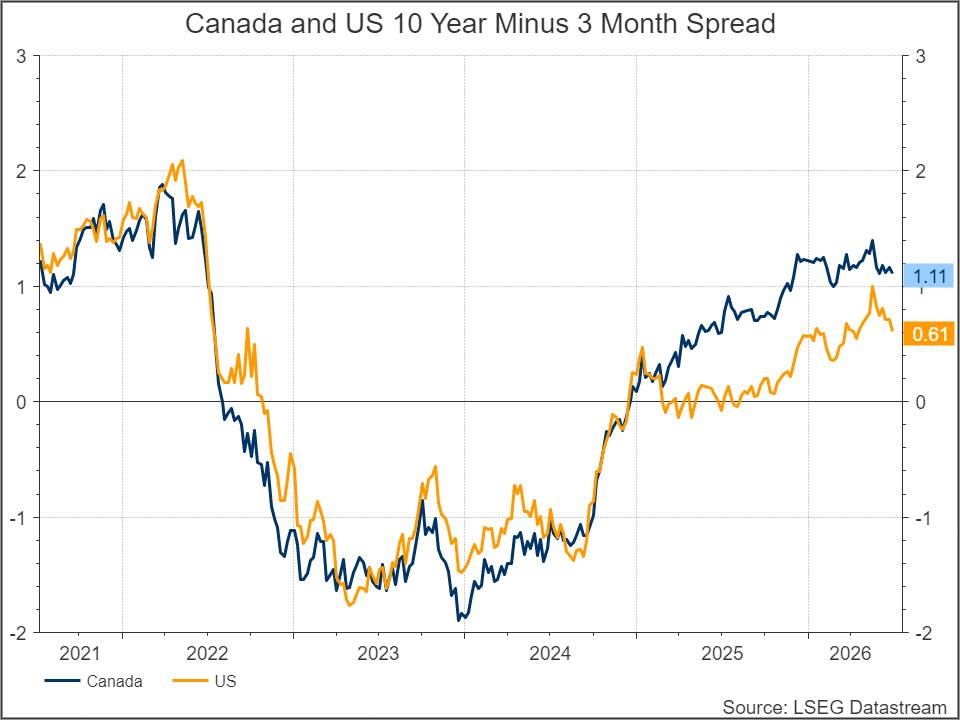
- S&P/TSX Financials have far outpaced U.S. peers (Banks +31.7% vs. -1.2% for S&P 500 Financials), aided by a steady Canadian short end and capex-driven steepening at the long end — a more favourable margin backdrop than in the U.S.
A Rare Broad-Based Upgrade Cycle
Heading into the Q3 2026 earnings season, analyst sentiment across the S&P 500 has turned uniformly positive. Every one of the 11 GICS sectors is now showing a positive net earnings revision reading — meaning upward earnings estimate revisions are outnumbering downward revisions over the trailing three months — for the first time in a stretch that has been rare since 2021. This synchronized upgrade cycle marks a notable shift from the more mixed, sector-by-sector revision pattern that has characterized much of the past two years, where pockets of strength (typically IT and Industrials) have coexisted with persistent weakness elsewhere (typically Consumer Discretionary, Consumer Staples and Materials).
The S&P 500 aggregate net earnings revision reading currently stands at 7.87, having climbed sharply off a trough in early 2026 (Exhibit 1). That aggregate improvement is not concentrated in one or two mega-cap sectors — it is broad-based, with every constituent sector index now printing above zero.
Leaders of the Upgrade Cycle: Energy, IT and Industrials
Three sectors are driving the bulk of the improvement in aggregate earnings sentiment. Information Technology (+18.63) and Energy (+18.00) currently carry the highest net earnings revision scores of any sector, with Industrials close behind at +9.86. All three have seen a marked re-acceleration in revisions since the turn of the year, after each experienced a mid-cycle dip through the second half of 2025.
Energy’s improvement is the most abrupt of the three, moving from negative territory as recently as late 2025 to the top of the sector rankings within a matter of months — a shift closely tied to the run-up in oil prices discussed below. IT and Industrials, by contrast, show a steadier, more sustained climb, consistent with continued strength in AI-related capital spending and a broader industrial capex cycle.
Revenue Revisions Confirm the Earnings Signal
A key reason to take the earnings revision breadth seriously is that it is corroborated, sector for sector, by net revenue revisions. As with earnings, all 11 sectors currently show positive net revenue revisions (Exhibit 2), and the sector leadership is nearly identical: IT (+17.36), Energy (+15.06) and Industrials (+13.97) again top the rankings, while Materials (+11.89) has also moved decisively positive on revenue even as its earnings revision reading (+3.39) remains comparatively modest.
This alignment matters. When earnings upgrades are accompanied by revenue upgrades of similar magnitude, it points to analysts raising numbers because they expect stronger demand and top-line growth, not simply because they expect wider margins or cost discipline. That is a more durable basis for an earnings upgrade cycle heading into a reporting season, and it reduces the risk that the Q3 beats-and-raises narrative is purely a function of easy comparisons or expense management.
The Exception: Financials Losing Steam
The one sector where the revision picture and the price action are starting to diverge is Financials. While Financials’ net earnings revision score remains positive at +5.42 and its net revenue revision score is a modest +1.64 — the lowest of any sector on revenue — both readings have been rolling over from a materially higher level earlier in the cycle, when Financials led the market on revisions through much of 2025.
That loss of momentum is now showing up in performance. Over the trailing six months, Financials is the weakest-performing S&P 500 sector with a total return of -1.2%, trailing even Consumer Discretionary at -0.8% (Exhibit 3). Both sectors are now lagging a S&P 500 index return of 10.2%, alongside Communication Services (+0.8%) and Health Care (+3.5%) at the bottom of the sector return rankings.
The Iran Conflict: A Double-Edged Sword
A significant part of the current sector story is geopolitical. Tensions between the US and Iran have escalated again in recent days: after a June interim agreement and ceasefire, the US carried out fresh strikes on Iranian targets in early July, and President Trump subsequently said he considered the ceasefire over, citing renewed attacks on commercial vessels in the Strait of Hormuz. Brent crude jumped over 5% on the news and has continued to trade in the high-$70s per barrel, well above pre-escalation levels, though prices remain volatile and dependent on the state of negotiations.
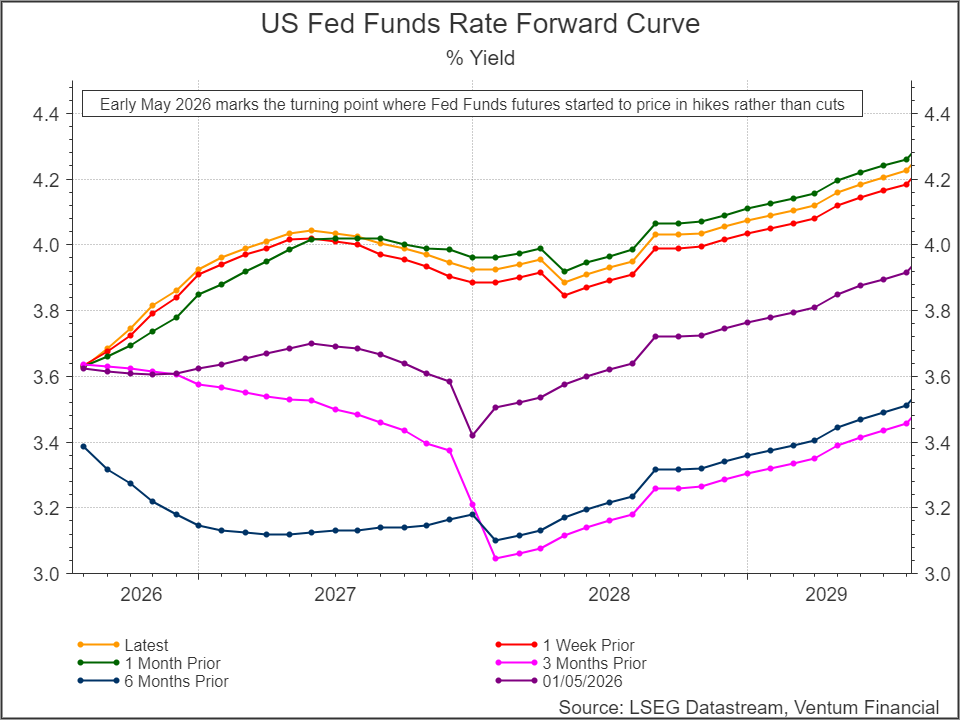
That oil-price move is the single biggest tailwind behind Energy’s six-month total return of 19.7% and its leadership in both earnings and revenue revisions. But the same conflict is a headwind elsewhere. Higher and more volatile energy prices are adding to inflation pressure, which in turn supports the case for interest rates staying higher for longer — a dynamic that weighs on rate-sensitive Financials and pinches discretionary consumer spending power. That combination helps explain why Consumer Discretionary, despite modestly positive earnings and revenue revisions, has been one of the weakest sectors on price performance over the past six months, and why Financials’ revision momentum has started to fade even as the sector’s absolute revision readings stay in positive territory.
Canada: A More Mixed Picture Than the U.S.
Unlike the S&P 500’s uniformly positive sweep, the S&P/TSX shows a far more bifurcated revision picture heading into Q3. The TSX aggregate net earnings revision reading sits at a modest 1.85, and four of the 11 sectors — Consumer Discretionary (-3.54), Consumer Staples (-4.61), Communication Services (-2.8) and, most notably, Real Estate (-13.4) — remain in negative territory on earnings. Financials (+5.87) and Health Care (+5.8) are the clear earnings-revision leaders, with Energy (+4.58) also re-accelerating sharply since late 2025 in a pattern that mirrors the U.S. sector’s oil-driven turnaround. Real Estate stands out as the weak spot: its earnings revisions are by far the most negative of any Canadian sector, a signal that rate-sensitive names are still seeing estimates cut even as the broader market improves.
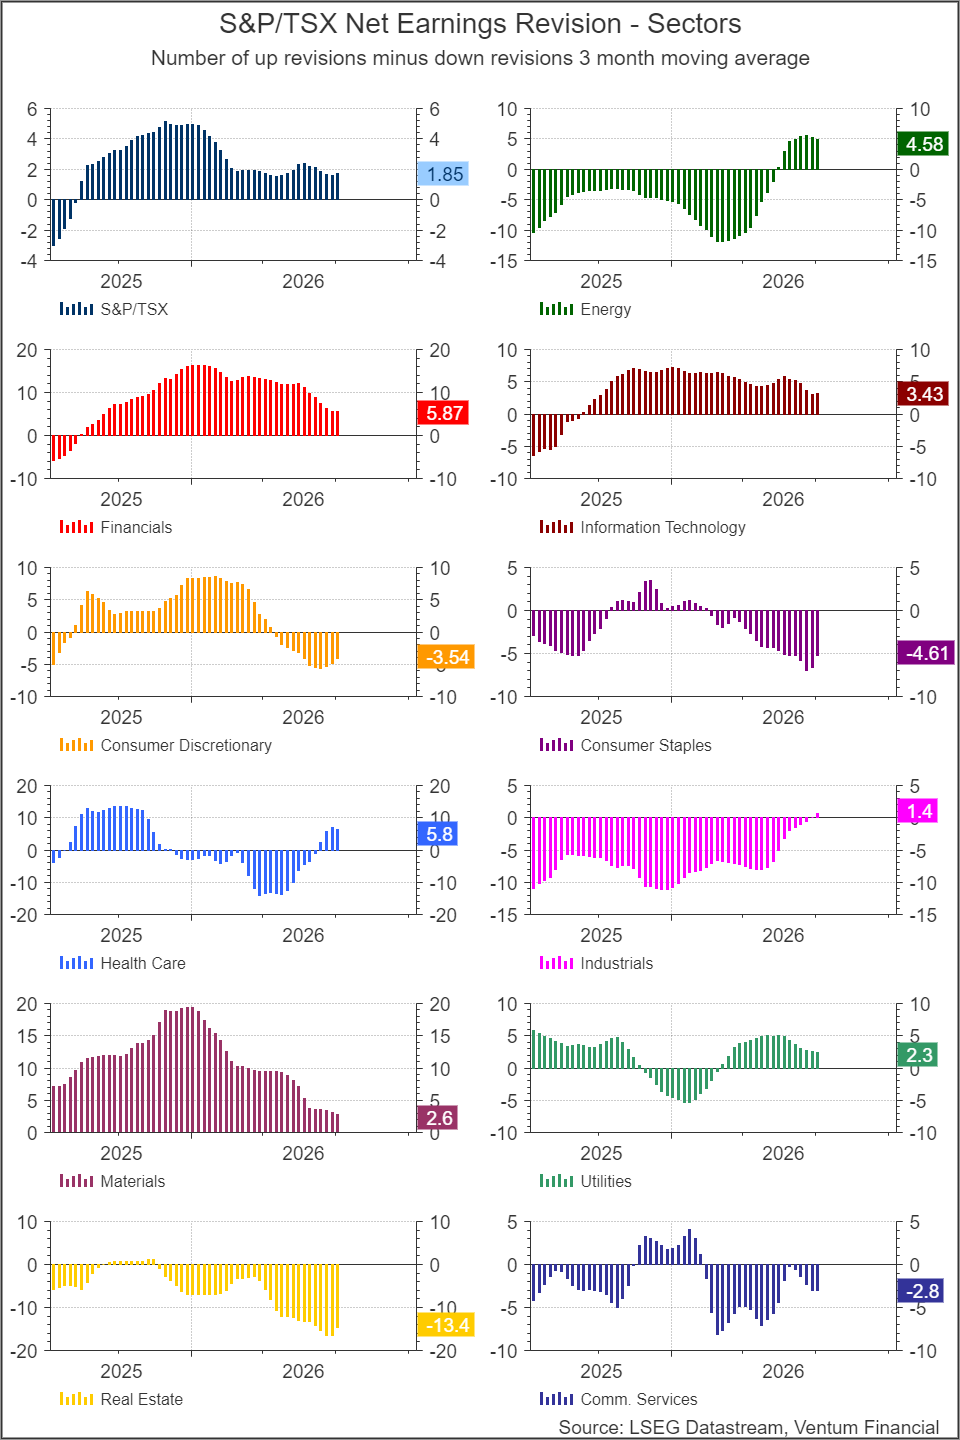
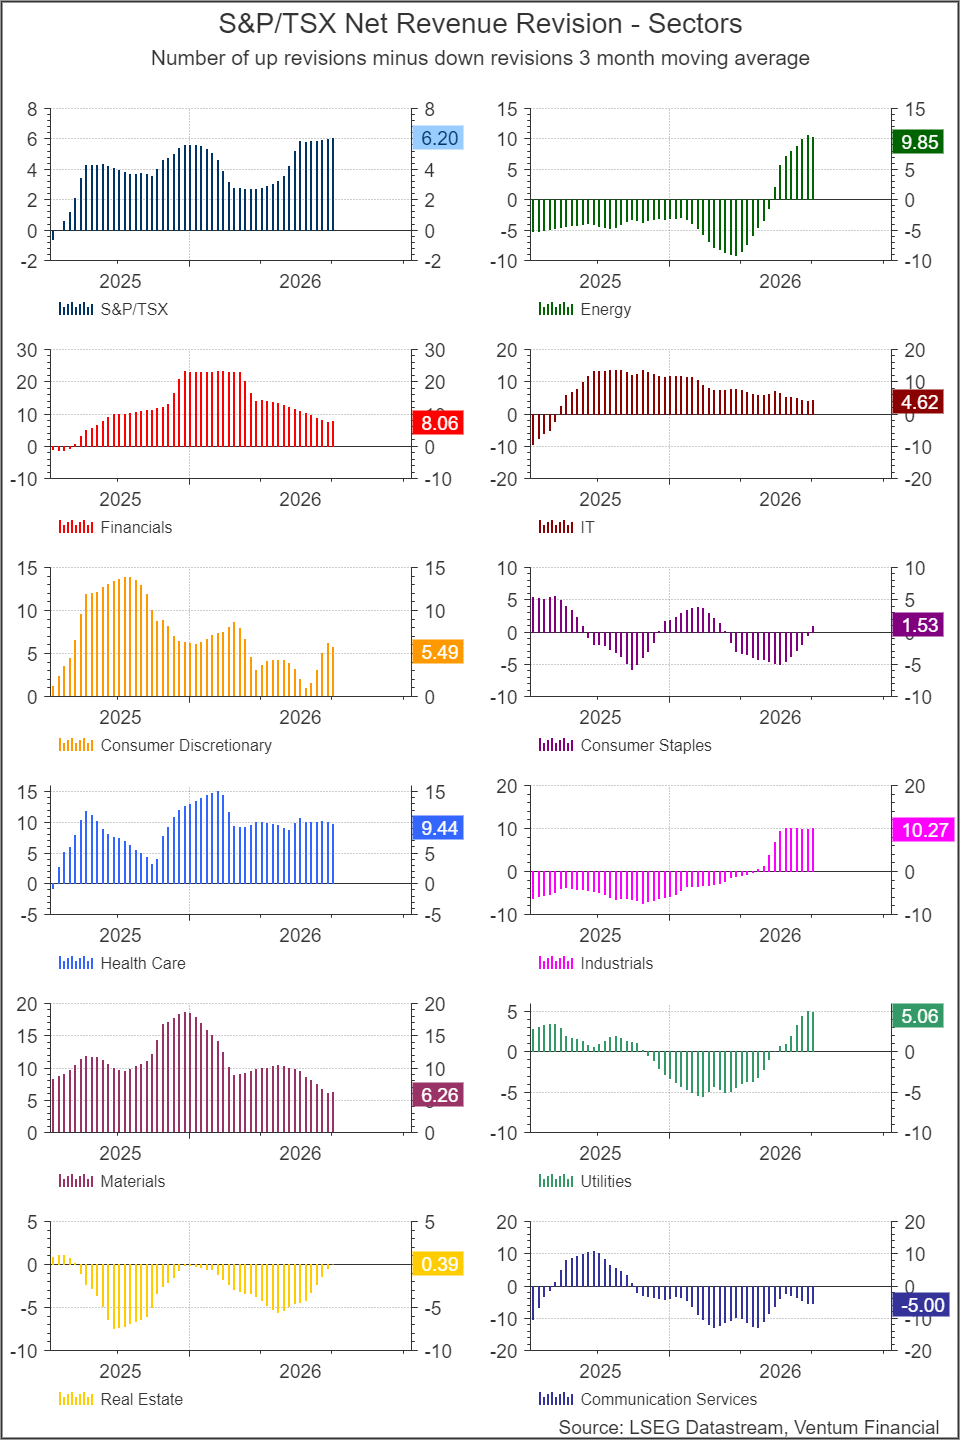
Revenue revisions tell a somewhat more encouraging story, with 10 of 11 sectors positive and only Communication Services (-5.00) negative on both earnings and revenue — making it the one sector where the deterioration looks broad-based rather than margin-specific. The gap between revenue and earnings revisions is also informative elsewhere: Real Estate’s revenue revision is roughly flat (+0.39) even as earnings estimates are being slashed, pointing to margin and financing-cost pressure rather than a demand problem, while Industrials shows the opposite pattern — strong revenue revisions (+10.27) paired with only marginally positive earnings revisions (+1.4), suggesting top-line growth is not yet translating into bottom-line upgrades. Taken together, the TSX data suggests Canadian equity investors should be more selective heading into Q3 than their U.S. counterparts, with Energy, Financials and Health Care offering the cleanest upgrade stories and Real Estate and Communication Services warranting caution, both of which are also pressured by declining population.
A Note on Financials: Diverging Yield Curve Dynamics
The performance gap between Canadian and U.S. Financials is stark: S&P/TSX Banks have returned 31.7% and broader Financials 23.2% over the period to 30/06/2026, compared to a -1.2% six-month total return for S&P 500 Financials. Much of that divergence traces back to yield curve dynamics rather than earnings revisions alone. In Canada, the front end of the curve is expected to stay steady rather than see further hikes, easing funding-cost pressure on banks, while heavy capital spending on large-scale projects has helped lift the long end — a combination that steepens the curve in a way that typically benefits net interest margins. In the U.S., by contrast, the renewed inflation risk from the Iran-driven oil spike is keeping the market wary of higher-for-longer rates across the curve, a less favourable setup for bank margins and a key reason Financials has lagged even as its earnings and revenue revisions remain positive.
Han Li . MA CFA
Bert Quattrociocchi, BA CFA
Discretionary Asset Management and Portfolio Strategy
© 2018-2023 Refinitiv. All rights reserved. Republication or redistribution of Refinitiv content, including by framing or similar means, is prohibited without the prior written consent of Refinitiv. Refinitiv and the Refinitiv logo are trademarks of Refinitiv and its affiliated companies.
Ventum Financial Corp. www.ventumfinancial.com
Vancouver Office
2500 – 733 Seymour Street
Vancouver, BC V6B 0S6
Ph: 604-664-2900 | Fax: 604-664-2666
For a complete list of branch offices and contact information, please visit our website.
Participants of all Canadian Marketplaces. Members: Canadian Investment Regulatory Organization, Canadian Investor Protection Fund and AdvantageBC International Business Centre – Vancouver. Estimates and projections contained herein are our own and are based on assumptions which. we believe to be reasonable. Information presented herein, while obtained from sources we believe to be reliable, is not guaranteed either as to accuracy or completeness, nor in providing it does Ventum Financial Corp. assume any responsibility or liability. This information is given as of the date appearing on this report, and Ventum Financial Corp. assumes no obligation to update the information or advise on further developments relating to securities. Ventum Financial Corp. and its affiliates, as well as their respective partners, directors, shareholders, and employees may have a position in the securities mentioned herein and may make purchases and/or sales from time to time. Ventum Financial Corp. may act, or may have acted in the past, as a financial advisor, fiscal agent or underwriter for certain of the companies mentioned herein and may receive, or may have received, a remuneration for their services from those companies. This report is not to be construed as an offer to sell, or the solicitation of an offer to buy, securities and is intended for distribution only in those jurisdictions where Ventum Financial Corp. is registered as an advisor or a dealer in securities. Any distribution or dissemination of this report in any other jurisdiction is strictly prohibited.
For further disclosure information, reader is referred to the disclosure section of our website.