

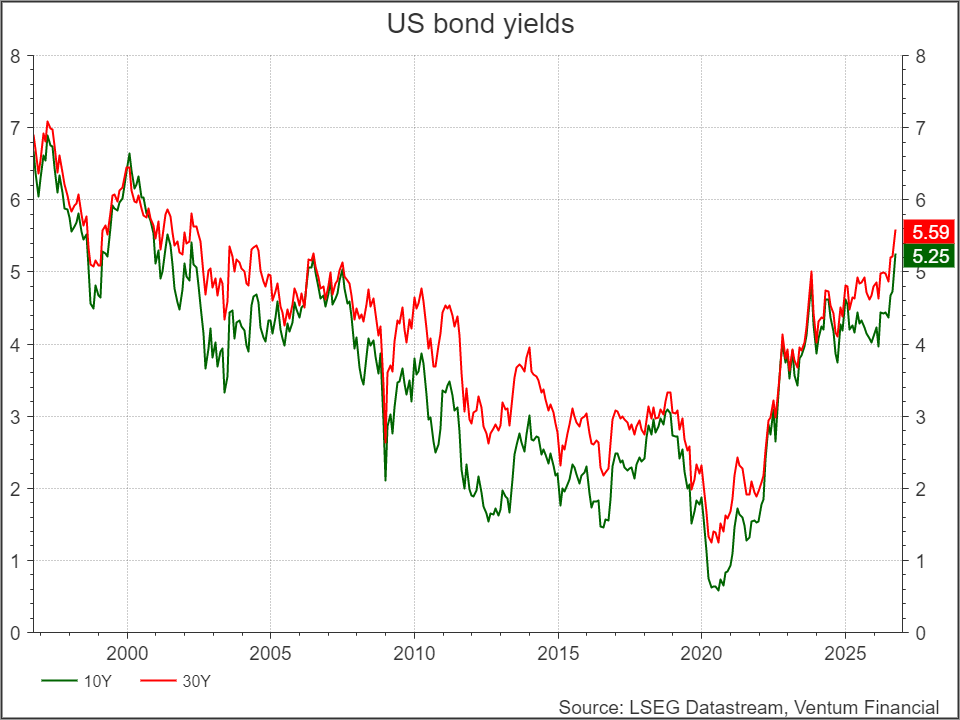
For nearly two decades, investors grew used to cheap money. That era is now firmly in the rear-view mirror. This week the 30-year U.S. Treasury yield climbed to roughly 5.6%, a level not seen since 2002. The 10-year followed to about 5.25%, its highest since 2007. Those numbers might look familiar to anyone who managed money before the financial crisis, but the forces behind them are distinctly modern. An economy that is registering some of the best growth, an oil shock from the Middle East, a U.S. fiscal deficit running near 6% of GDP, and a borrowing spree to fund the AI build-out are all hitting the bond market at once. The result is a repricing of the long end that is reshaping the landscape for every asset class.
The economy continues to surprise to the upside. Recent purchasing managers’ surveys point to faster activity alongside rising input costs, and August payrolls came in at roughly three times consensus. That strength is colliding with an energy shock. The prolonged conflict in the Middle East has kept oil near US$100 a barrel, and the link between crude and the 10-year yield is now the tightest in years. The Federal Reserve responded in September with its first rate hike in more than three years, and most FOMC members expect at least one more before year-end.
Supply is adding to the pressure. The federal deficit is running near 6% of GDP, and annual interest costs recently surpassed US$1 trillion for the first time. Meanwhile, the AI infrastructure build-out has turned the hyperscalers into major issuers. Alphabet, Amazon, Meta and Oracle had issued more than US$220 billion in bonds by late August, more than double their 2025 total. Much of that debt sits at longer maturities, where it competes directly with Treasuries for a limited pool of buyers.
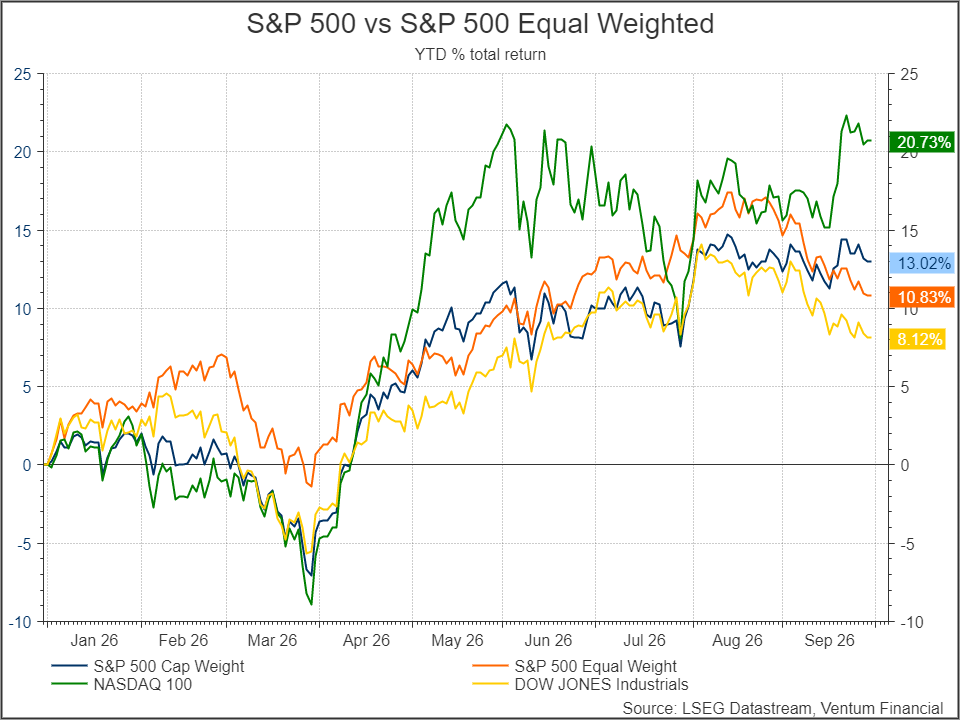
Tech shrugs off higher rates as breadth fades
Technology would normally be among the sectors hurt most by rising long-term yields, because more of its value comes from earnings far in the future. This year it has led regardless. Year-to-date, the Nasdaq 100 has returned 20.7%, compared with 13.0% for the S&P 500, 10.8% for the S&P 500 Equal Weight and 8.1% for the Dow. Earnings explain much of the gap. Profit expectations for the large AI-linked names have kept rising, and the Nasdaq returned to record highs in late September on the strength of the AI semiconductor complex.
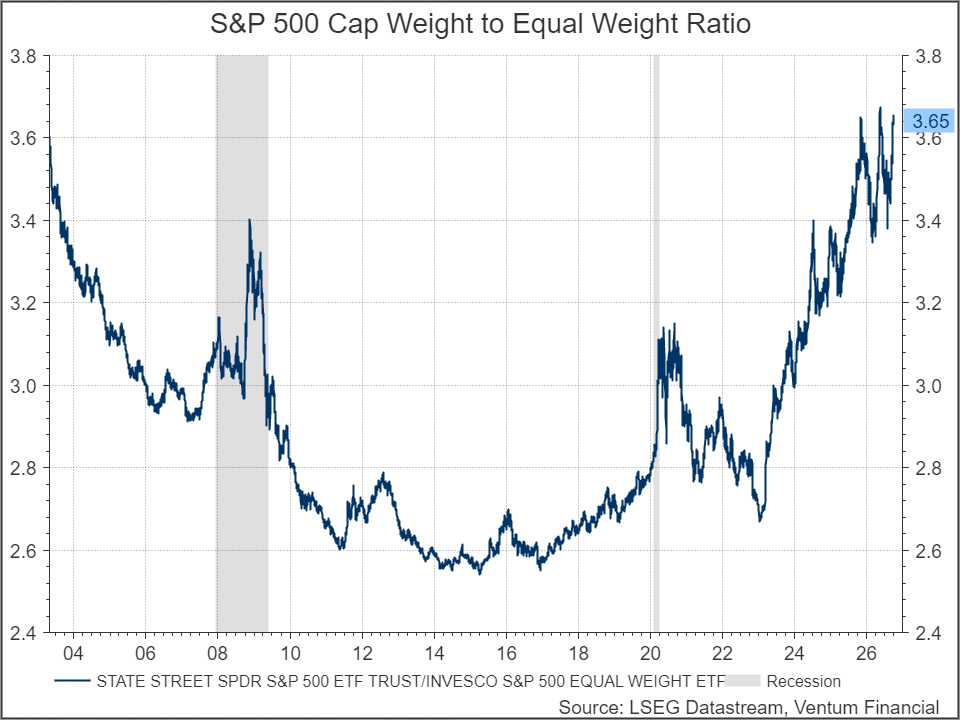
Efforts to broaden the market have not lasted. The equal-weight index gives the average company a much larger voice. It led early in the year and again over the summer, suggesting leadership was finally spreading beyond the mega-caps. Since mid-August, however, it has fallen back behind the cap-weighted index. Smaller constituents tend to be more sensitive to financing costs and domestic demand, so they have felt the rise in yields more acutely. Large-cap tech, by contrast, has been cushioned by its much higher margins and earnings momentum. For now, market leadership has narrowed back to the largest names.
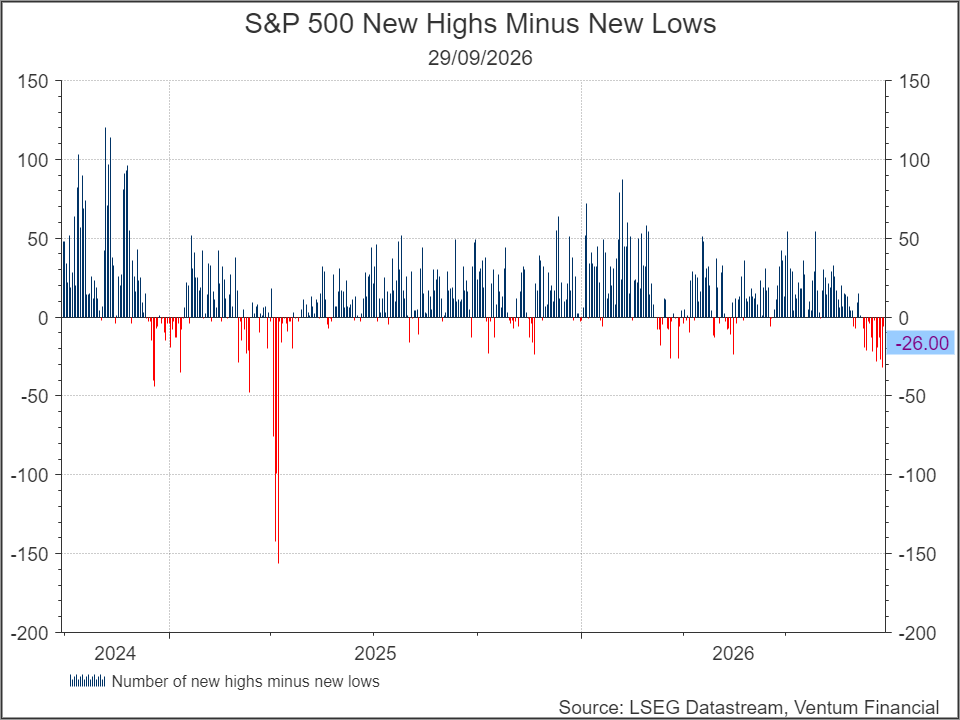
Beneath the surface, breadth is narrowing
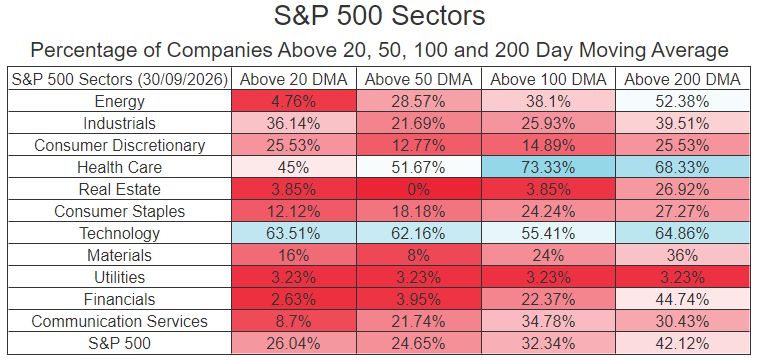
The index-level gains hide a much weaker picture underneath. The S&P 500 remains within reach of its August peak, yet the number of stocks setting new 52-week lows has overtaken the number setting new highs. That spread has been negative for most of September and stood at -26 on September 29, its weakest stretch since the spring 2025 selloff. Only 42% of S&P 500 companies trade above their 200-day moving average, and just a quarter are above their 50-day. In other words, most stocks are in a downtrend while the index holds up.
Sector data show where the damage is. Technology is the only sector where a majority of companies sit above all four moving averages, with roughly 62% to 65% above both their 50-day and 200-day lines. Health care is the one other area of relative strength, with more than two-thirds of its members above their 100- and 200-day averages. The rate-sensitive sectors have been hit hardest by the rise in yields. Only 3% of utilities trade above any of their moving averages. No real estate stocks are above their 50-day line, and fewer than 4% of financials are. Consumer staples, materials and consumer discretionary are nearly as weak. Energy stands out for a different reason: it has pulled back sharply in the short term, with fewer than 5% of names above their 20-day average, but more than half remain above their 200-day. That suggests a pause within a longer uptrend as oil eased on hopes for Middle East talks, rather than a breakdown.
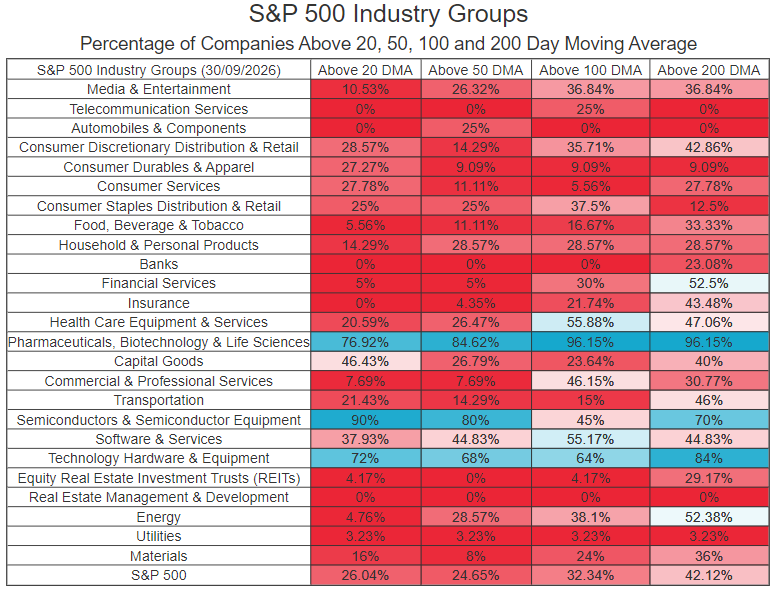
Even within technology, the strength is uneven. Semiconductor and hardware stocks show exceptionally broad participation. Ninety percent of chipmakers trade above their 20-day moving average, and 70% are above their 200-day. In technology hardware, 84% of companies are above their 200-day line. This is a rally carried by the whole AI supply chain, not just a few leaders, as hyperscaler capital spending flows through to the companies that build the chips, servers and networking gear behind the build-out.
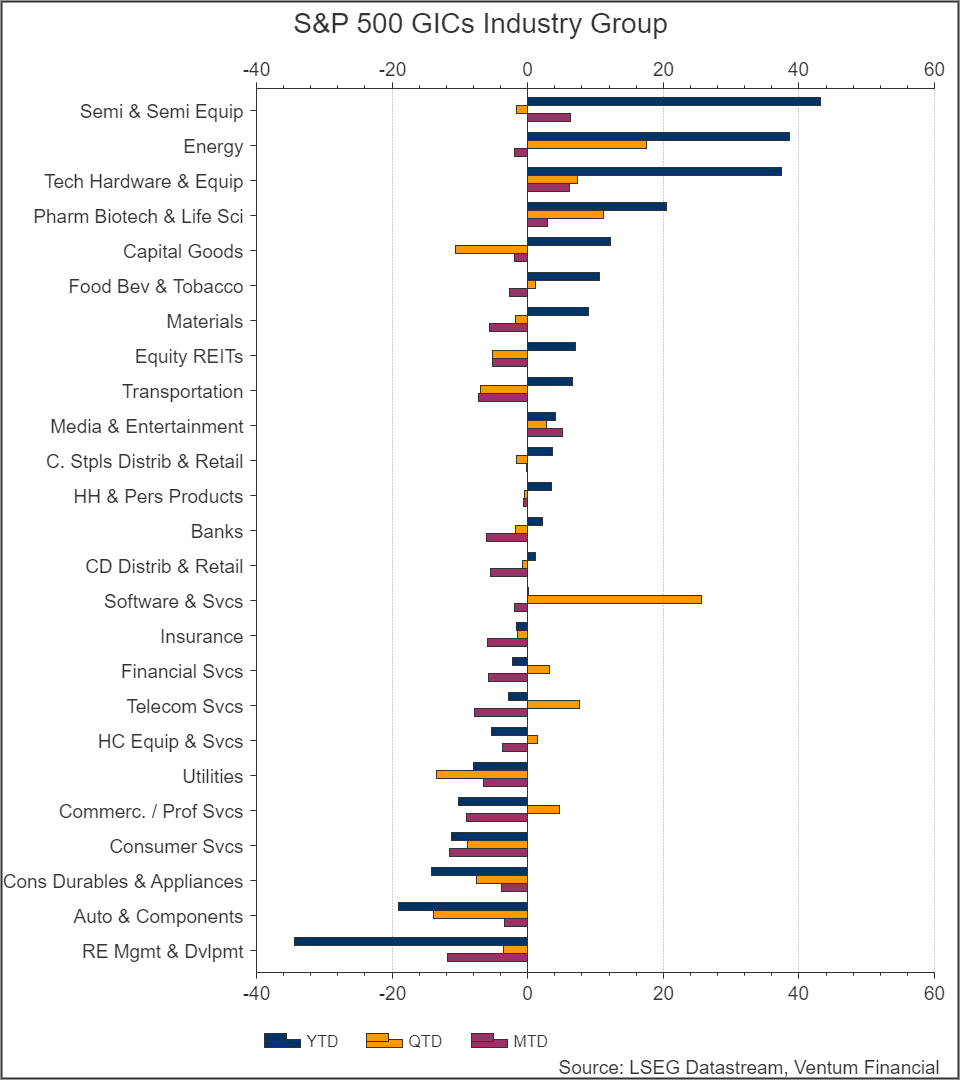
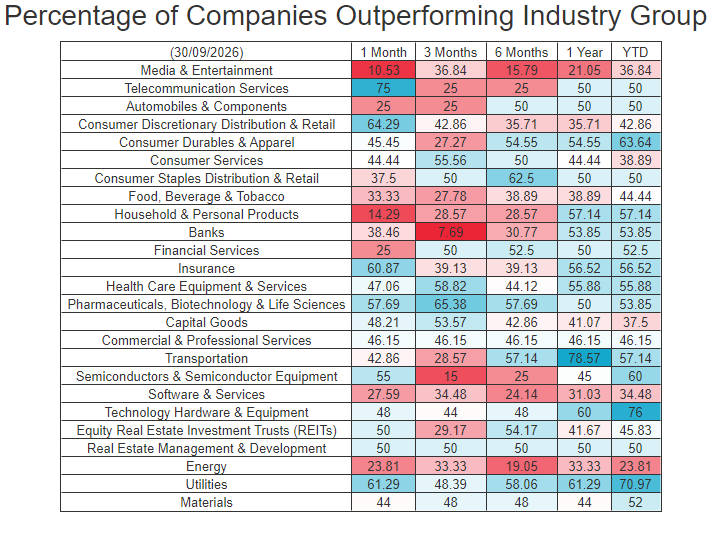
Software tells a very different story. It is the best-performing industry group quarter-to-date, yet only about a third of its companies have outperformed the group this year, and fewer than half trade above their 50-day or 200-day moving averages. Over the past six months, the share falls to roughly one in four. The group’s gains rest on a handful of companies, while the typical software name continues to lag. Investors appear to be separating clear AI beneficiaries from companies whose business models could be disrupted by the same technology.
The capex boom, by the numbers
Over the course of this year, many strategists have argued that U.S. growth is being driven by AI capital spending. We don’t dispute that. Where we differ is on its staying power: we are more optimistic, and we believe this cycle of spending will prove more durable than many expect.
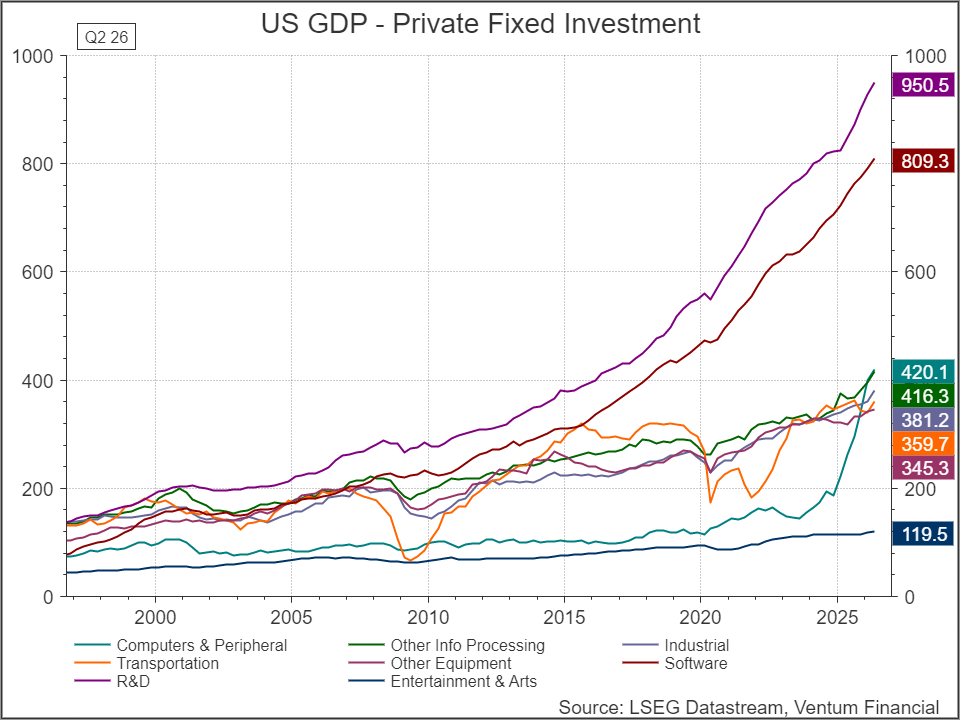
First of all, the scale of the shift is striking when you look at where businesses are actually putting their money. For most of the 2000s, investment in computers and peripherals, the category that includes data centre servers, was among the smallest components of private fixed investment, at roughly $100 billion. Only entertainment and arts spending was lower. That has changed abruptly. Spending on computers and peripherals has more than doubled since early 2025 to $420 billion as of the second quarter. It has overtaken information processing, industrial and transportation equipment, and now ranks third among all categories of capital spending.
The change in software and research and development has been even larger over time. Around 2000, both sat alongside the other major categories at roughly $150 to $200 billion each. Today, R&D spending stands at $950 billion and software at $809 billion, more than double any category of physical equipment.
That longer history is the basis for our optimism. R&D and software investment has compounded steadily for more than two decades. It barely paused through the financial crisis and the pandemic, even as transportation and industrial spending collapsed. The recent surge in server spending is not a standalone bubble. It is the hardware catching up to a structural, multi-decade shift in how companies invest. After twenty years of flat spending, computing equipment is growing from a low base. The hyperscalers are also financing the build-out with long-dated debt, a sign that they see it as a multi-year commitment rather than a one-off. Corporate America’s capital budget has moved decisively toward compute, code and research, and we expect that shift to continue. Looking forward, three further measures reinforce our view.
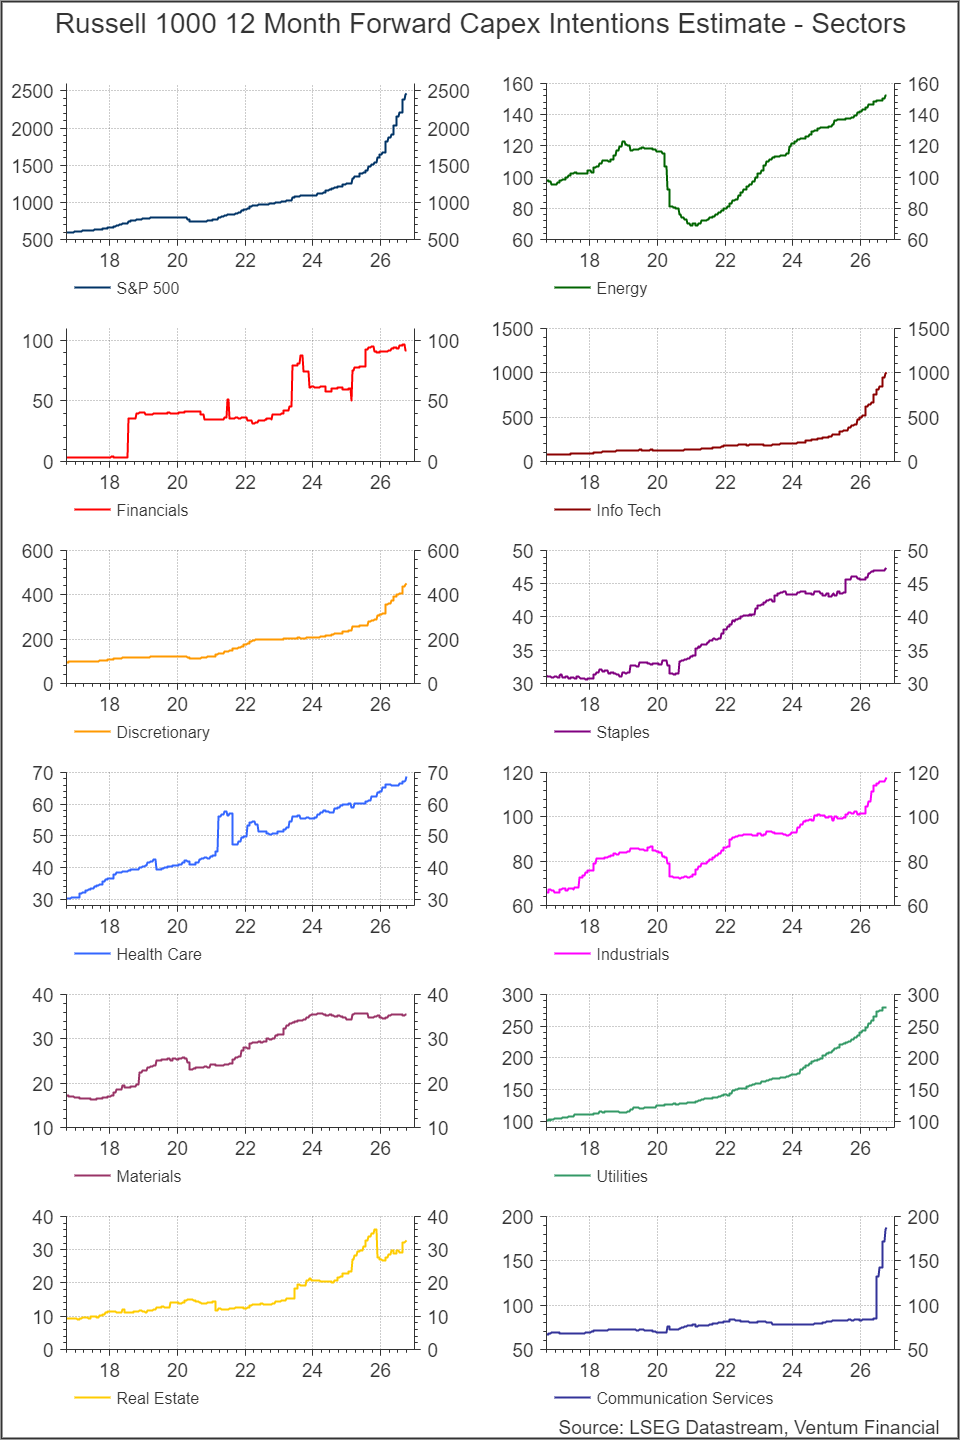
First, spending plans are still accelerating, and they are spreading beyond technology. Forward 12-month capex intentions for the S&P 500 have roughly doubled since early 2025. Information technology accounts for much of that increase, with its intentions rising about fivefold in two years. Albeit slower, the demand is now reaching the rest of the economy, forward capex inventions are all positive for the other 10 sectors. Utilities’ capex intentions have nearly tripled since 2017, and the pace has picked up as data centre power demand grows. Industrials jumped to a record this year, and consumer discretionary has more than doubled since 2024. Communication services, home to two of the largest hyperscalers, was flat for nearly a decade before surging this year.
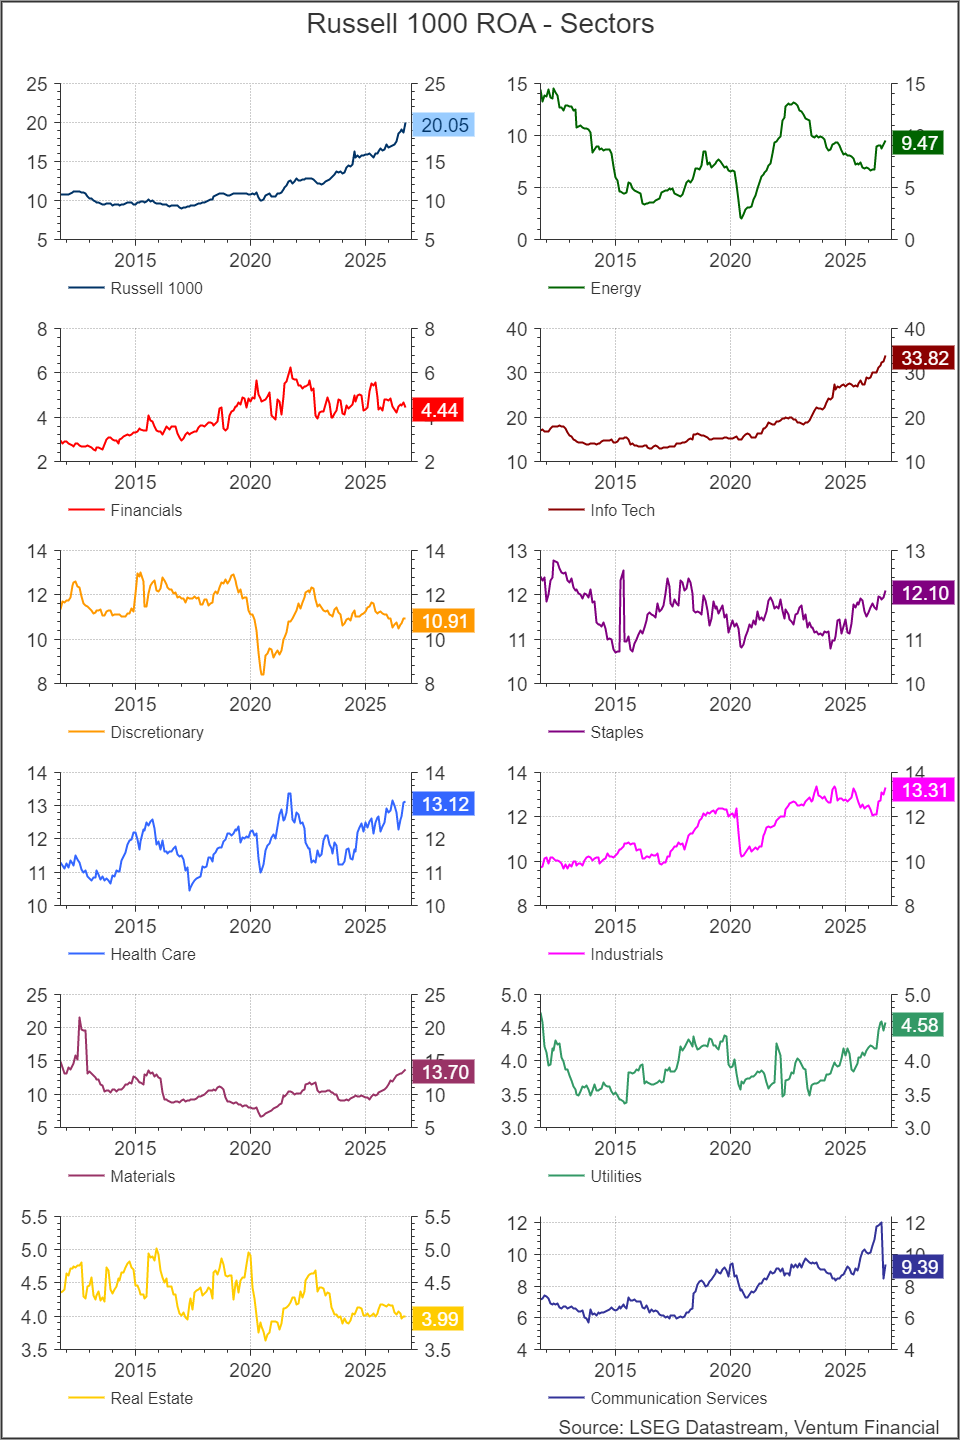
Second, the investment is paying off. Return on assets for the Russell 1000 has doubled from about 10% for most of the 2010s to just over 20% today. For information technology, the sector spending most aggressively, it has more than doubled to nearly 34%. Returns are rising alongside capital spending rather than being diluted by it. That is the opposite of the late 1990s, when heavy investment came before a collapse in returns.
Nvidia made the point clearly this week when it surprised the market with a $150 billion increase to its share buyback authorization. That is the largest increase in history for any company, well ahead of Apple’s $110 billion in 2024. The company is investing at the centre of the AI build-out while also returning cash to shareholders on a record scale. It shows that the largest high-growth companies generate enough cash to withstand, and even look past, sharply higher interest rates.
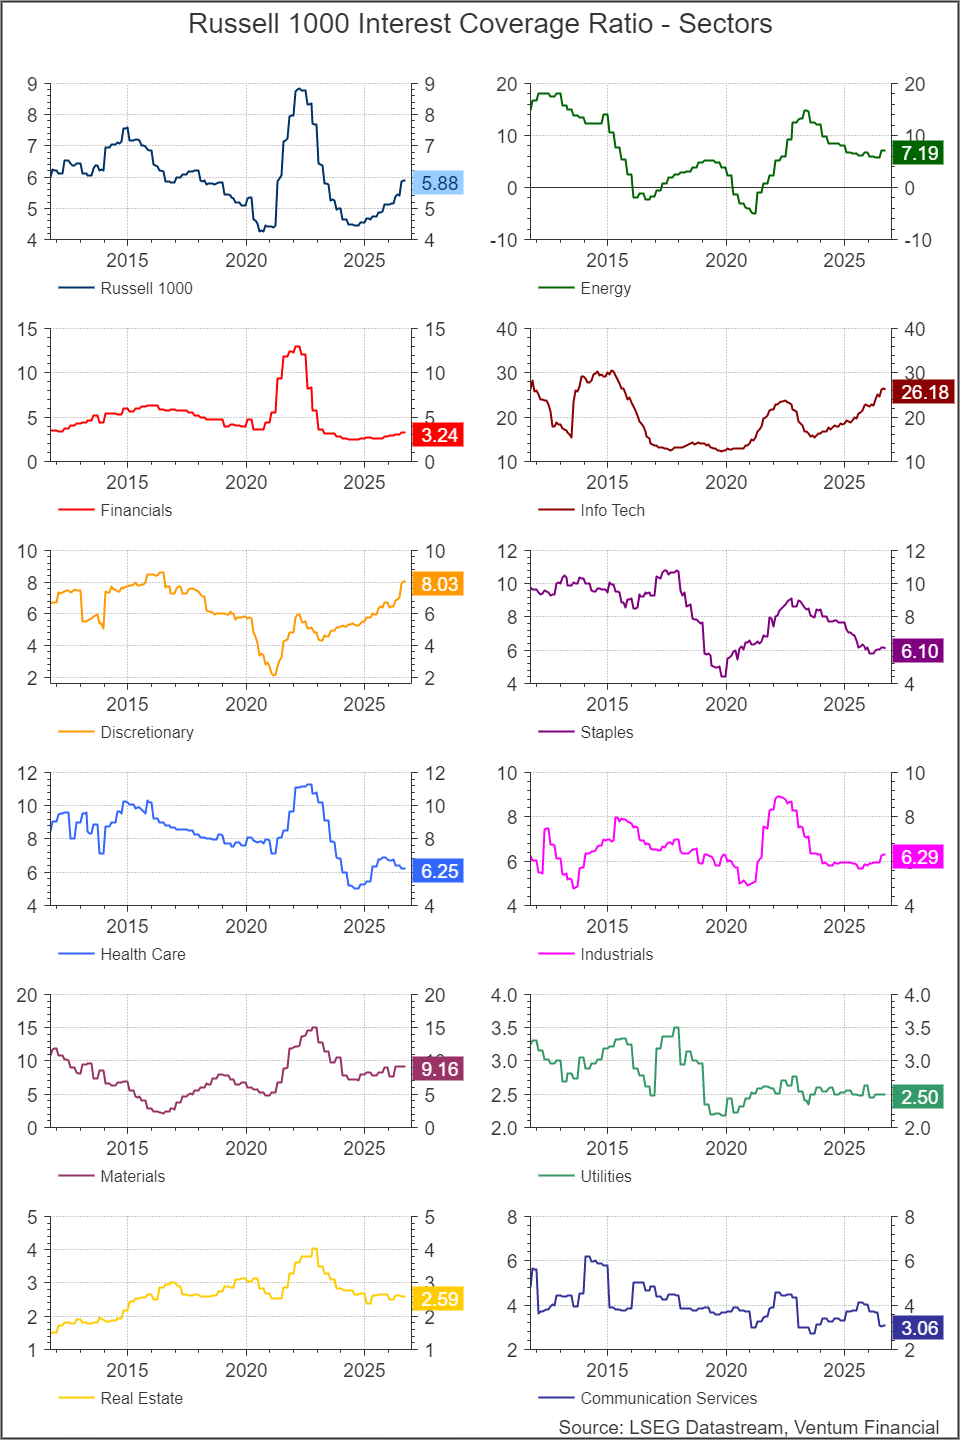
Third, balance sheets can support the spending. Even with long-term yields above 5% and heavy bond issuance, the Russell 1000’s interest coverage ratio has risen to 5.9 times, up from about 4.5 times in 2024. Information technology earns more than 26 times its interest expense, which leaves ample room to borrow. The hyperscalers’ willingness to fund the build-out with long-dated debt reflects a multi-year commitment, not a one-off.
There are weak spots, however. Utilities cover their interest just 2.5 times, and communication services about 3 times, with coverage down sharply this year as spending surged. Both are sectors where AI-related capital needs are growing fastest, and both are exposed to higher rates. This helps explain why utilities have been among the worst performers in the recent breadth data, with only 3% of names above their 200-day moving average.
Where higher rates start to break things
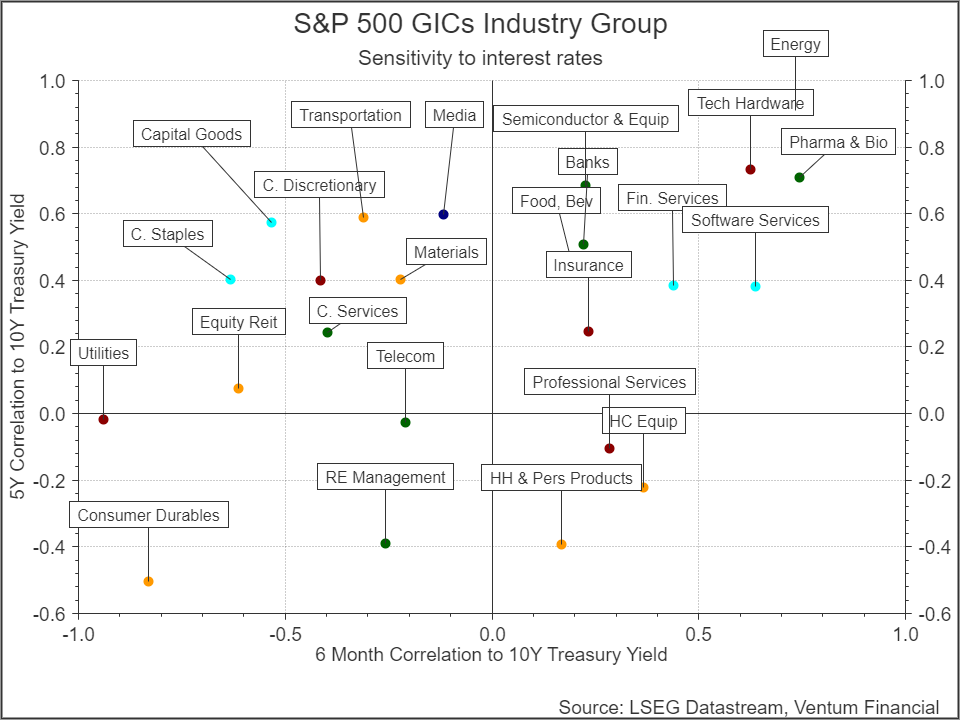
Plotting each industry group’s correlation to the 10-year Treasury yield over five years and over six months shows which parts of the market can absorb higher rates and which cannot.
Some of the results are what the economic cycle would predict. Energy typically performs best late in the cycle and has one of the strongest positive correlations to rising yields. More interesting is where technology sits. Technology hardware and software have among the most positive correlations to yields over both the past five years and the past six months, with semiconductors positive on both measures as well. Normally, higher rates hurt high-growth companies because they reduce the present value of earnings far in the future. This time the relationship runs the other way. Technology is driving the growth, and faster growth is what pushes yields higher. Rising rates are partly a consequence of the sector’s strength rather than a threat to it.
The more revealing part of the chart is the top-left quadrant. Industry groups there have historically moved with rates over five years but have turned negative over the past six months. These are the areas where higher yields are starting to break things. Capital goods would normally benefit in a strong economy, but it has had a difficult run, dragged down largely by Boeing’s recent performance, even though most of the group has still posted solid year-to-date results. Media, transportation, materials and consumer discretionary have all turned negative as well, and consumer staples has followed. Further left, utilities, REITs and consumer durables show strongly negative recent correlations, consistent with the collapse in breadth across rate-sensitive sectors.
Is big tech now a quality trade?
This raises the central question for portfolio positioning: on a relative basis, can large, high-growth technology companies now be considered high quality? We believe the answer is yes.
The traditional definition of quality focuses on high returns on capital, strong balance sheets and earnings that hold up under pressure. Large-cap technology now meets each of these tests better than most of the market. Its return on assets of nearly 34% is well above the Russell 1000 average. It earns more than 26 times its interest expense, compared with less than 3 times for utilities and communication services. And its earnings momentum is strong enough that rising rates have coincided with outperformance rather than a de-rating. Meanwhile, the sectors investors have traditionally used as defensive holdings, such as utilities, staples and REITs, are the ones struggling most as yields climb.
This does not mean the group is without risk. Valuations are demanding, leadership is concentrated, and, as the software breadth data show, not every technology company is sharing in the gains. Selectivity matters. In an environment of 5% long-term yields, however, we believe the combination of high returns, strong balance sheets and self-reinforcing growth gives large technology companies a stronger claim to quality than many of the traditionally defensive parts of the market.
Han Li . MA CFA
Bert Quattrociocchi, BA CFA
Discretionary Asset Management and Portfolio Strategy
© 2018-2023 Refinitiv. All rights reserved. Republication or redistribution of Refinitiv content, including by framing or similar means, is prohibited without the prior written consent of Refinitiv. Refinitiv and the Refinitiv logo are trademarks of Refinitiv and its affiliated companies.
Ventum Financial Corp. www.ventumfinancial.com
Vancouver Office
2500 – 733 Seymour Street
Vancouver, BC V6B 0S6
Ph: 604-664-2900 | Fax: 604-664-2666
For a complete list of branch offices and contact information, please visit our website.
Participants of all Canadian Marketplaces. Members: Canadian Investment Regulatory Organization, Canadian Investor Protection Fund and AdvantageBC International Business Centre – Vancouver. Estimates and projections contained herein are our own and are based on assumptions which. we believe to be reasonable. Information presented herein, while obtained from sources we believe to be reliable, is not guaranteed either as to accuracy or completeness, nor in providing it does Ventum Financial Corp. assume any responsibility or liability. This information is given as of the date appearing on this report, and Ventum Financial Corp. assumes no obligation to update the information or advise on further developments relating to securities. Ventum Financial Corp. and its affiliates, as well as their respective partners, directors, shareholders, and employees may have a position in the securities mentioned herein and may make purchases and/or sales from time to time. Ventum Financial Corp. may act, or may have acted in the past, as a financial advisor, fiscal agent or underwriter for certain of the companies mentioned herein and may receive, or may have received, a remuneration for their services from those companies. This report is not to be construed as an offer to sell, or the solicitation of an offer to buy, securities and is intended for distribution only in those jurisdictions where Ventum Financial Corp. is registered as an advisor or a dealer in securities. Any distribution or dissemination of this report in any other jurisdiction is strictly prohibited.
For further disclosure information, reader is referred to the disclosure section of our website.