
The S&P 500 reached a new all-time high last week, yet the advance remains tightly held. The leading factor styles year-to-date are Growth (+15.83%), High Volatility (+15.68%) and Momentum (+12.66%), driven by the concentration of US Information Technology mega-caps, semiconductors and hardware names that anchor these baskets. The outperformance of the High Volatility factor in particular reflects strong gains in semiconductor and hardware companies such as Micron, Western Digital and SanDisk, which have been among the standout performers in the current rally. On the other end of the spectrum, Moat (-3.34%) was the clear laggard, weighed down by its higher concentration in software names that underperformed amid the rotation toward hardware and AI infrastructure plays. Low Volatility (+3.84%) also trailed the broader index, pressured by the interest rate environment — defensive, rate-sensitive names offering lower return potential in a period where risk appetite and growth expectations remained elevated.
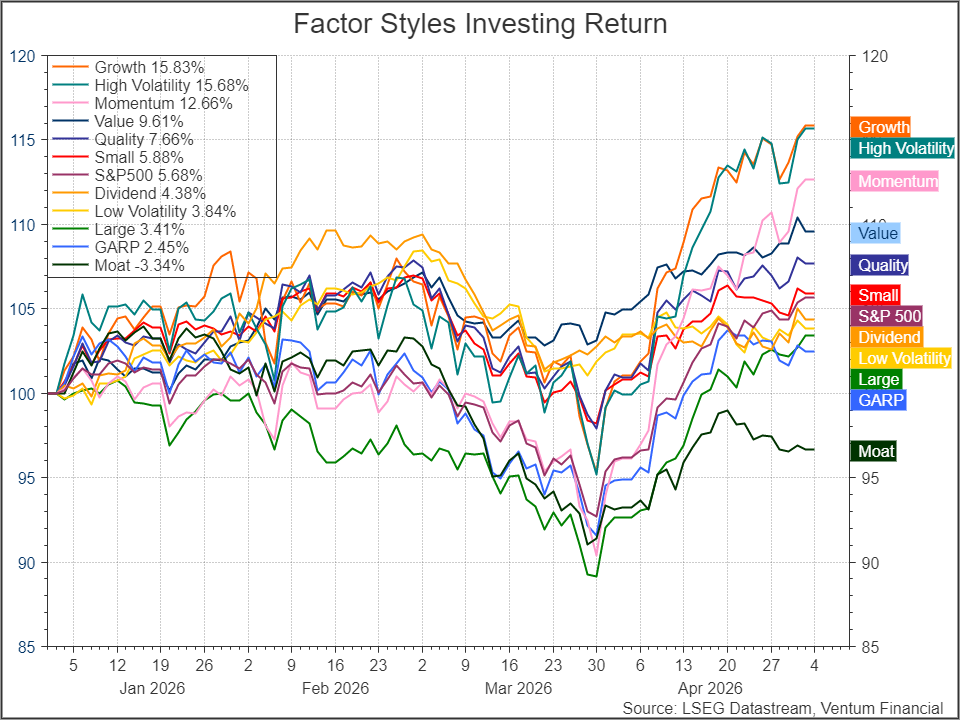
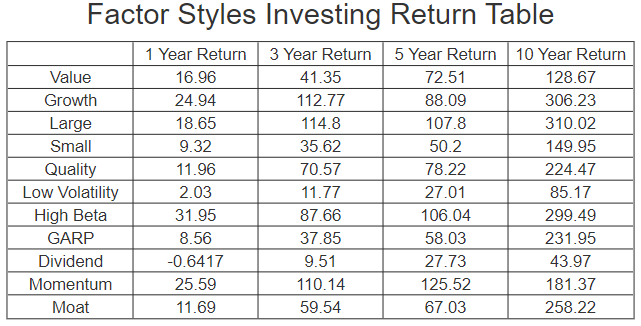
The same three leading factor styles are not merely short-term winners. These are the same factors that have compounded ahead of all peers over 1, 3, 5 and 10 years. Growth has returned +24.94% over one year, +112.77% over three years, and +306.23% over ten — compounding a lead that defensive factors have been unable to close. This reflects the gravitational pull of US Information Technology, specifically semiconductor and hardware names, and the mega-cap platforms that anchor both the Growth and High Beta factor baskets.
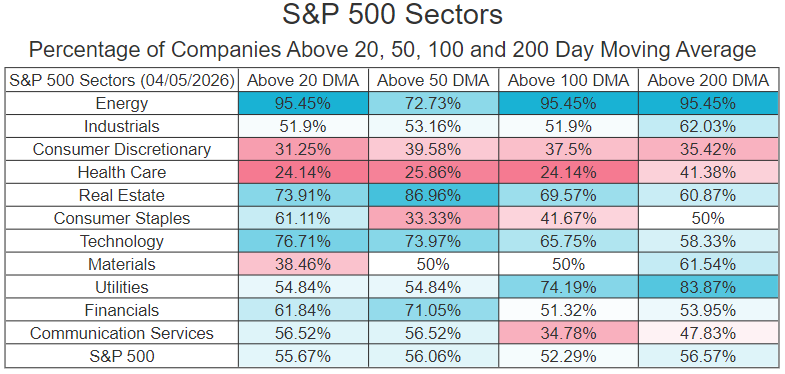
Value’s +9.61% YTD return stands out against the broader index’s +5.68%, but its source is not a mean-reversion of cheap multiples. The gain is concentrated in Energy — sector that have benefited from the ongoing conflict in the Middle East and the risk premium embedded in commodity prices. On a 20-day view, Energy leads sector breadth with 95.45% of its companies above the short-term moving average. This is a geopolitical trade, not a value rotation.
The cap-weight to equal-weight ratio tells an important story about market structure. Having troughed at 3.34 on February 27th — in the immediate aftermath of the Iran conflict escalation — the ratio has rebounded sharply to 3.55 and is pressing back toward its recent peak near 3.65. The index is being carried by its heaviest constituents, while the median stock has recovered far less ground.
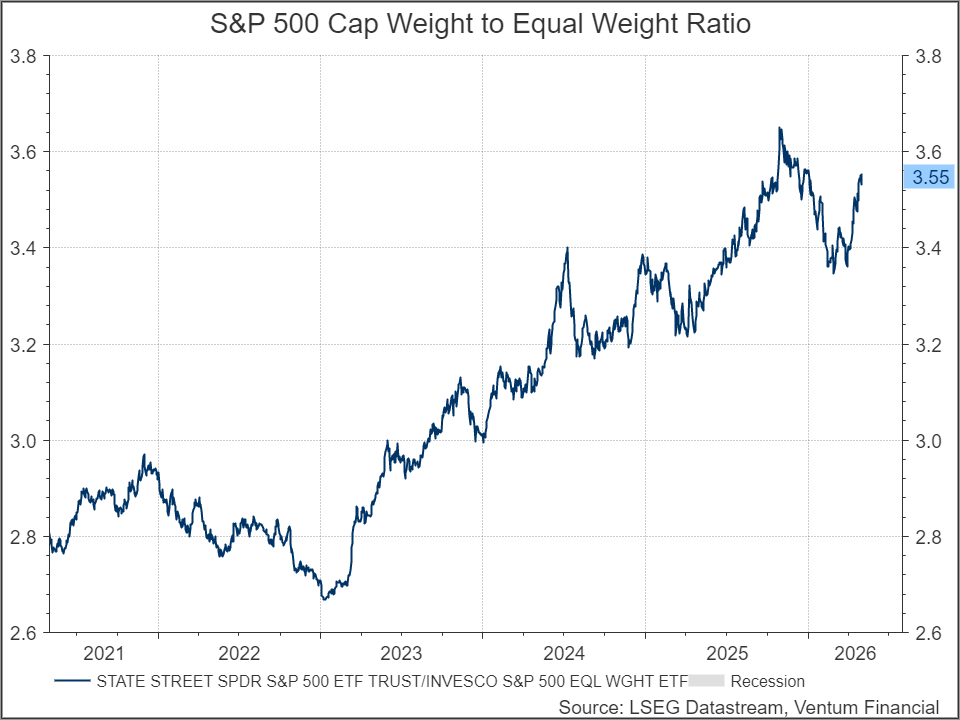
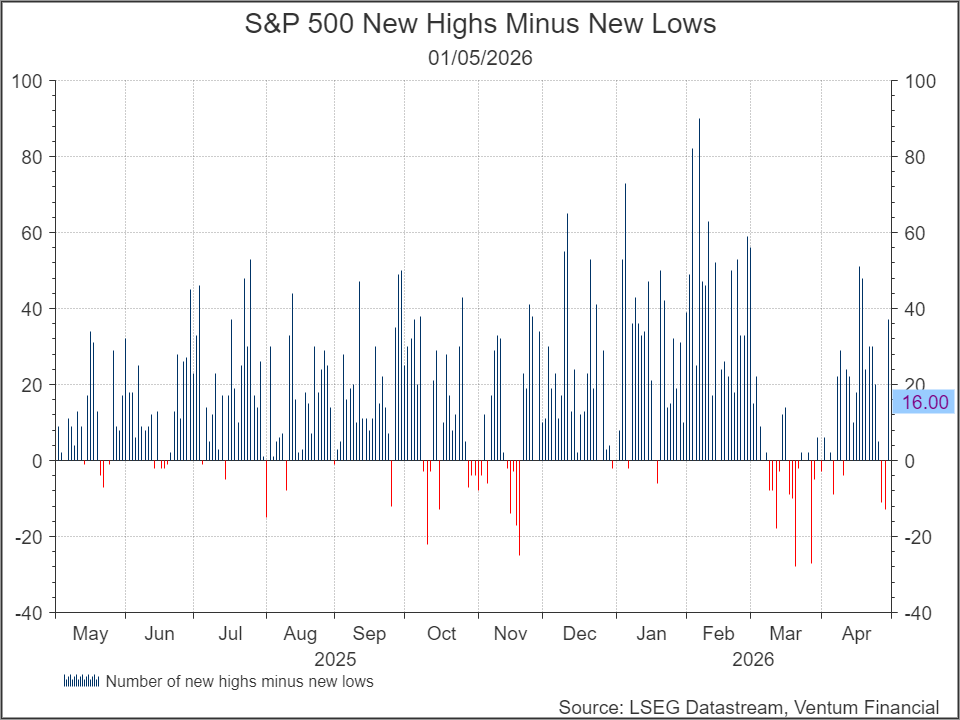
That compression in participation is further confirmed by the new-highs-minus-new-lows reading of just 16 — a historically thin number for an index printing all-time highs.
Only 56% of S&P 500 companies are trading above their 200-day moving average, and only 55% are above their 20-day moving average. Near-term sector breadth reinforces this picture: Technology (76.7% above the 20 DMA), Energy (95.5%) and Real Estate (73.9%) are the current leaders, while Health Care (24.1%), Consumer Discretionary (31.3%) and Materials (38.5%) lag significantly.
The S&P 500 is making new highs, but the anatomy of that advance warrants scrutiny. Growth, High Volatility and Momentum are doing the work — backed by Technology mega-caps and semiconductor names — while the majority of the index remains below trend. The cap-to-equal-weight ratio is rising again, breadth is historically narrow, and investors positioned in market-cap-weighted indices may be receiving a misleading signal about the health of the underlying market. The key question going forward is whether breadth expands to validate the index level, or whether concentration continues to compress — raising the stakes for a small number of names.
© 2018-2023 Refinitiv. All rights reserved. Republication or redistribution of Refinitiv content, including by framing or similar means, is prohibited without the prior written consent of Refinitiv. Refinitiv and the Refinitiv logo are trademarks of Refinitiv and its affiliated companies.
Ventum Financial Corp. www.ventumfinancial.com
Vancouver Office
2500 – 733 Seymour Street
Vancouver, BC V6B 0S6
Ph: 604-664-2900 | Fax: 604-664-2666
For a complete list of branch offices and contact information, please visit our website.
Participants of all Canadian Marketplaces. Members: Canadian Investment Regulatory Organization, Canadian Investor Protection Fund and AdvantageBC International Business Centre – Vancouver. Estimates and projections contained herein are our own and are based on assumptions which. we believe to be reasonable. Information presented herein, while obtained from sources we believe to be reliable, is not guaranteed either as to accuracy or completeness, nor in providing it does Ventum Financial Corp. assume any responsibility or liability. This information is given as of the date appearing on this report, and Ventum Financial Corp. assumes no obligation to update the information or advise on further developments relating to securities. Ventum Financial Corp. and its affiliates, as well as their respective partners, directors, shareholders, and employees may have a position in the securities mentioned herein and may make purchases and/or sales from time to time. Ventum Financial Corp. may act, or may have acted in the past, as a financial advisor, fiscal agent or underwriter for certain of the companies mentioned herein and may receive, or may have received, a remuneration for their services from those companies. This report is not to be construed as an offer to sell, or the solicitation of an offer to buy, securities and is intended for distribution only in those jurisdictions where Ventum Financial Corp. is registered as an advisor or a dealer in securities. Any distribution or dissemination of this report in any other jurisdiction is strictly prohibited.
For further disclosure information, reader is referred to the disclosure section of our website.